2025 Iowa
9–4 (6–3 Big Ten), coached by Kirk Ferentz, finished No. 17 in the AP poll. Share
Schedule and results
- Biggest upsetBeat No. 13 Vanderbilt 34–27Dec 31
Vanderbilt was ranked No. 13 and favored to win.
- Most excitingLost to No. 11 Indiana 15–20Sep 27
The win probability swung the most, by CollegeFootballData.com’s excitement index.
| Date | Opponent | Result | Elo |
|---|---|---|---|
| Aug 30 | vs UAlbany | W 34–7 | 89% |
| Sep 6 | at 16Iowa State | L 13–16 | 40% |
| Sep 13 | vs Massachusetts | W 47–7 | 88% |
| Sep 19 | at Rutgers | W 38–28 | 47% |
| Sep 27 | vs 11Indiana | L 15–20 | 53% |
| Oct 11 | at Wisconsin | W 37–0 | 61% |
| Oct 18 | vs Penn State | W 25–24 | 56% |
| Oct 25 | vs Minnesota | W 41–3 | 63% |
| Nov 8 | vs 6Oregon | L 16–18 | 44% |
| Nov 15 | at 17USC | L 21–26 | 40% |
| Nov 22 | vs Michigan State | W 20–17 | 86% |
| Nov 28 | at Nebraska | W 40–16 | 56% |
| Dec 31Bowls & playoff | vs 13VanderbiltReliaQuest Bowl | W 34–27 | 46% |
Elo: a pregame chance from scores alone.
How it ended: Beat Vanderbilt 34–27 in the ReliaQuest Bowl; No. 17 in the final AP poll; 6th in the Big Ten.
In program history: The 10th-best season in program history by end-of-season Elo (of 133 on file).
AP poll, week by week
- Final: 17
Led the nationKaden Wetjen: punt return yards (563 yds), punt return average (26.8)
- Record
- 9–4
- Conference
- 6–3 6th in Big Ten
- AP final
- No. 17 peak No. 17
- Points
- 381–209
- Coach
- Kirk Ferentz
- Elo
- 1697 +99 this season
- SP+ rating
- 19.7 No. 12 of 136; offense No. 37, defense No. 6, special teams No. 8
- SRS
- 13.9 No. 16 of 136 in FBS
- Returning
- 49% of last season’s EPA, No. 46 of 134
- Recruiting class
- No. 38 roster talent No. 42 in FBS
- Offensive coordinator
- Tim Lester
- Defensive coordinator
- Phil Parker
- Offense
- West Coast
- Defense
- 4–2–5
How good, play by play
| EPA per play | Success | Explosiveness | FBS rank | |
|---|---|---|---|---|
| Offense | 0.10 | 43% | 1.13 | 65th of 136 |
| Defense | -0.05 | 40% | 1.05 | 12th of 136 |
| Opponent-adjusted | 0.10 off -0.08 def | 43% off 37% def | — | 60th off 6th def |
Passing and running
| Pass success | Depth of target | Deep throws | Line yards | Stuffed | |
|---|---|---|---|---|---|
| Offense | 41% | 8.8 yds | 15% | 3.40 | 12% |
| Defense | 40% | 9.5 yds | 14% | 3.00 | 16% |
How these are measured
Play-weighted averages over games against FBS opponents; raw numbers, not adjusted for the strength of the opponent. EPA (expected points added) measures how much each play changed the expected score; success rate counts plays that kept the offense on schedule; explosiveness is the average EPA on successful plays. Lower is better on defense. Ranked by EPA per play among teams that were FBS that season. The opponent-adjusted row (offense / defense) is CollegeFootballData.com’s WEPA, which accounts for who each team played. Passing and running: depth of target is how far downfield passes traveled in the air; deep throws are the share thrown deep, of the passes whose depth and direction the play-by-play describes (about half); line yards are the running yards per carry credited to the blockers; stuffed is the share of carries stopped at or behind the line. The defense’s line is what its opponents did. From CollegeFootballData.com, 2025 on.
Drives and havoc
| Points per trip inside the 40 | Average start | Havoc | |
|---|---|---|---|
| Offense | 4.4 | own 33 | 11% allowed |
| Defense | 3.3 | own 27 | 17% caused |
CORE rating 15.4, 22nd of 136 (offense 3.4, defense -12.1).
A trip inside the 40 is a drive that reaches the opponent’s 40-yard line; points per trip is how many it scored on average (allowed, on defense). Average start is where drives began (the defense’s line is where its opponents started). Havoc is the share of plays ending in a tackle for loss, a forced fumble, an interception or a pass broken up. CORE is CollegeFootballData.com’s context- and opponent-adjusted rating (points better than an average team; lower is better on defense). From CollegeFootballData.com.
Leaders
| Passing yards | Mark Gronowski QB | 1,741 yds |
| Passing touchdowns | Mark Gronowski QB | 10 TD |
| Rushing yards | Kamari Moulton RB | 878 yds |
| Rushing touchdowns | Mark Gronowski QB | 16 TD |
| Receiving yards | D.J. Vonnahme TE | 434 yds |
| Receiving touchdowns | D.J. Vonnahme TE | 3 TD |
| Tackles | Karson Sharar LB | 83 tkl |
| Sacks | Ethan Hurkett DL | 7.5 sacks |
| Interceptions | Zach Lutmer DB | 3 INT |
Top recruits in the 2025 class
| Iose Epenesa DL | ★★★★ | No. 36 |
| Burke Gautcher LB | ★★★★ | No. 252 |
| Thomas Meyer TE | ★★★★ | No. 270 |
| Carson Cooney LB | ★★★★ | No. 294 |
| Terrence Smith WR | ★★★ | No. 537 |
247Sports composite rankings via CollegeFootballData.com; national rank in the class.
The 2025 class by position
| Signed | Stars | Rating | |
|---|---|---|---|
| Quarterbacks | 2 | 3.0 | 0.858 |
| Running backs | 1 | 3.0 | 0.869 |
| Receivers | 4 | 3.3 | 0.882 |
| Offensive line | 2 | 3.0 | 0.878 |
| Defensive line | 2 | 3.5 | 0.927 |
| Linebackers | 2 | 4.0 | 0.910 |
| Defensive backs | 3 | 3.0 | 0.857 |
| Athletes and specialists | 2 | 3.0 | 0.867 |
| Whole class | 18 | 3.2 | 0.880 |
High-school signees by position group, with their average stars and 247Sports composite rating (out of 1), via CollegeFootballData.com. Athletes are signees with no set position.
Drafted in 2026
The 2026 draft| Rd 2 | Logan Jones C | Chicago Bears |
| Rd 3 | Gennings Dunker OT | Pittsburgh Steelers |
| Rd 4 | Kaden Wetjen WR | Pittsburgh Steelers |
| Rd 5 | Beau Stephens OG | Seattle Seahawks |
| Rd 6 | Karson Sharar LB | Arizona Cardinals |
| Rd 7 | T.J. Hall CB | New Orleans Saints |
| Rd 7 | Max Llewellyn DE | Miami Dolphins |
Roster 109
The 2025 roster109 players, with numbers, heights, hometowns and each player’s 2025 line; 61 have a stat line. See the roster
Transfers in 9
The 2025 portal Bryce Hawthorne DL | ★★★★ | from  South Dakota State |
 Jonah Pace DL | ★★★ | from  Central Michigan |
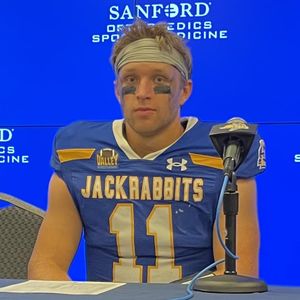 Mark Gronowski QB | ★★★ | from South Dakota State |
| Bryce George OT | ★★★ | from Ferris State |
 Jeremy Hecklinski QB | ★★★ | from  Wake Forest |
 Hank Brown QB | ★★★ | from  Auburn |
 Sam Phillips WR | ★★★ | from  Chattanooga |
 Shahid Barros CB | ★★★ | from  South Dakota |
 Ty Hudkins S | ★★★ | from  Purdue |
Transfers out 22
 John Nestor CB | ★★★ | to  Minnesota |
| Gavin Hoffman TE | ★★★ | to  Missouri |
| James Resar QB | ★★★ | to Independence C.C. |
| Brendan Sullivan QB | ★★★ | to  Tulane |
| Joey VanWetzinga DL | ★★★ | to Central Michigan |
| Leshon Williams RB | ★★★ | to  Kansas |
| Kaleb Brown WR | ★★★ | to  UAB |
| Max White RB | ★★★ | to  Wyoming |
| Rusty VanWetzinga TE | ★★★ | to Central Michigan |
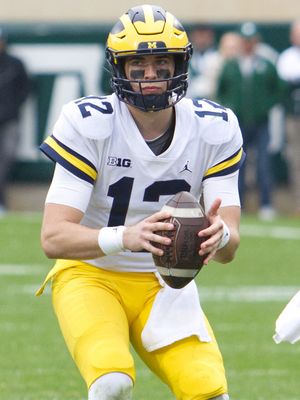 Cade McNamara QB | ★★★★ | to  East Tennessee State |
| Caden Crawford DE | ★★★ | to South Dakota |
| Chase Brackney DL | ★★★ | to  Sacramento State |
And 10 more, lower-rated or unrated.
All-Big Ten
4 first team, 2 second teamFirst team
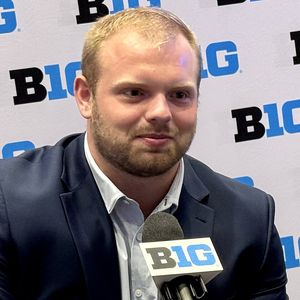 Logan JonesCCoaches-1; Media-1
- Beau StephensOGCoaches-1; Media-2
- Gennings DunkerOTCoaches-3; Media-1
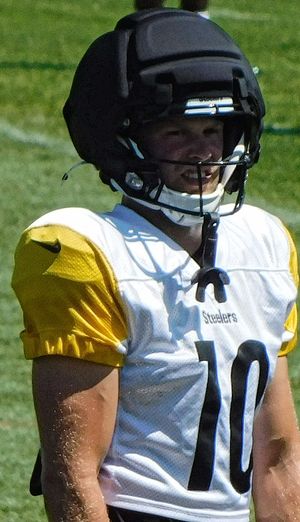 Kaden WetjenRSCoaches-1; Media-1
Second team
- Aaron GravesDLCoaches-2; Media-2
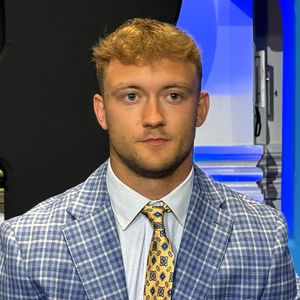 Zach LutmerDBCoaches-2; Media-3
From Wikipedia’s 2025 all-conference team article, with the selectors that named each player (AP-1: the Associated Press’s first team).
2025 Big Ten standings
Conference page| Team | Conf. | Overall | AP final |
|---|---|---|---|
| Indiana | 9–0 | 16–0 | 1 |
 Ohio State | 9–0 | 12–2 | 5 |
| Oregon | 8–1 | 13–2 | 4 |
 Michigan | 7–2 | 9–4 | 21 |
| USC | 7–2 | 9–4 | 20 |
| Iowa | 6–3 | 9–4 | 17 |
 Illinois | 5–4 | 9–4 | |
 Washington | 5–4 | 9–4 | |
| Minnesota | 5–4 | 8–5 | |
| Nebraska | 4–5 | 7–6 | |
 Northwestern | 4–5 | 7–6 | |
| Penn State | 3–6 | 7–6 | |
 UCLA | 3–6 | 3–9 | |
| Rutgers | 2–7 | 5–7 | |
| Wisconsin | 2–7 | 4–8 | |
| Michigan State | 1–8 | 4–8 | |
 Maryland | 1–8 | 4–8 | |
| Purdue | 0–9 | 2–10 |
Ordered by conference winning percentage, then conference wins. Division splits and tiebreakers aren’t applied.