
2025 Indiana
16–0 (9–0 Big Ten), coached by Curt Cignetti, finished No. 1 in the AP poll. Share
Schedule and results
- Biggest upsetBeat No. 1 Ohio State 13–10Dec 6
Ohio State was ranked No. 1 and favored to win.
- Most excitingBeat Iowa 20–15Sep 27
The win probability swung the most, by CollegeFootballData.com’s excitement index.
| Date | Opponent | Result | Elo |
|---|---|---|---|
| Aug 30 | vs Old Dominion | W 27–14 | 72% |
| Sep 6 | vs Kennesaw State | W 56–9 | 90% |
| Sep 12 | vs Indiana State | W 73–0 | 92% |
| Sep 20 | vs 9Illinois | W 63–10 | 57% |
| Sep 27 | at Iowa | W 20–15 | 47% |
| Oct 11 | at 3Oregon | W 30–20 | 30% |
| Oct 18 | vs Michigan State | W 38–13 | 88% |
| Oct 25 | vs UCLA | W 56–6 | 84% |
| Nov 1 | at Maryland | W 55–10 | 73% |
| Nov 8 | at Penn State | W 27–24 | 60% |
| Nov 15 | vs Wisconsin | W 31–7 | 89% |
| Nov 28 | at Purdue | W 56–3 | 89% |
| Dec 6 | vs 1Ohio StateBig Ten Championship | W 13–10 | 35% |
| Jan 1Bowls & playoff | vs 11AlabamaRose Bowl, CFP Quarterfinal | W 38–3 | 58% |
| Jan 9Bowls & playoff | vs5OregonPeach Bowl, CFP Semifinal | W 56–22 | 45% |
| Jan 19Bowls & playoff | vs 10MiamiCFP National Championship | W 27–21 | 60% |
Elo: a pregame chance from scores alone.
How it ended: Beat Miami 27–21 in the CFP National Championship; No. 1 in the final AP poll; Big Ten champions.
In program history: The best season in program history by end-of-season Elo (of 132 on file).
AP poll, week by week
- Wk 1: 20
- Wk 2: 23
- Wk 3: 22
- Wk 4: 19
- Wk 5: 11
- Wk 6: 8
- Wk 7: 7
- Wk 8: 3
- Wk 9: 2
- Wk 10: 2
- Wk 11: 2
- Wk 12: 2
- Wk 13: 2
- Wk 14: 2
- Wk 15: 2
- Wk 16: 1
- Final: 1
National championsNo. 1 in the final AP poll, and a title the school claims
Big Ten champions9–0 in the conference
Led the nationFernando Mendoza: passing touchdowns (41 TD), passer rating (182.9); Elijah Sarratt: receiving touchdowns (15 TD)
Heisman TrophyFernando Mendoza, QB; also the Maxwell, Walter Camp, Davey O’Brien and Manning
Consensus All-AmericanCarter Smith, OL
Walter Camp Coach of the YearCurt Cignetti, coach; also the Bear Bryant Award and Bobby Dodd Award
Broyles AwardBryant Haines, coach
- Record
- 16–0
- Conference
- 9–0 shared first in Big Ten
- AP final
- No. 1 peak No. 1
- Points
- 666–187
- Coach
- Curt Cignetti
- Elo
- 1882 +280 this season
- SP+ rating
- 32.4 No. 1 of 136; offense No. 2, defense No. 2, special teams No. 16
- SRS
- 27.4 No. 1 of 136 in FBS
- Returning
- 25% of last season’s EPA, No. 83 of 134
- Recruiting class
- No. 47 roster talent No. 72 in FBS
- Offensive coordinators
- Mike Shanahan and Chandler Whitmer
- Defensive coordinator
- Bryant Haines
- Offense
- Pro spread
- Defense
- Multiple 4–2–5
How good, play by play
| EPA per play | Success | Explosiveness | FBS rank | |
|---|---|---|---|---|
| Offense | 0.28 | 50% | 1.25 | 5th of 136 |
| Defense | -0.07 | 35% | 1.36 | 7th of 136 |
| Opponent-adjusted | 0.31 off -0.09 def | 51% off 33% def | — | 2nd off 3rd def |
Passing and running
| Pass success | Depth of target | Deep throws | Line yards | Stuffed | |
|---|---|---|---|---|---|
| Offense | 60% | 9.4 yds | 16% | 3.50 | 11% |
| Defense | 40% | 8.0 yds | 12% | 2.30 | 27% |
How these are measured
Play-weighted averages over games against FBS opponents; raw numbers, not adjusted for the strength of the opponent. EPA (expected points added) measures how much each play changed the expected score; success rate counts plays that kept the offense on schedule; explosiveness is the average EPA on successful plays. Lower is better on defense. Ranked by EPA per play among teams that were FBS that season. The opponent-adjusted row (offense / defense) is CollegeFootballData.com’s WEPA, which accounts for who each team played. Passing and running: depth of target is how far downfield passes traveled in the air; deep throws are the share thrown deep, of the passes whose depth and direction the play-by-play describes (about half); line yards are the running yards per carry credited to the blockers; stuffed is the share of carries stopped at or behind the line. The defense’s line is what its opponents did. From CollegeFootballData.com, 2025 on.
Drives and havoc
| Points per trip inside the 40 | Average start | Havoc | |
|---|---|---|---|
| Offense | 5.1 | own 31 | 11% allowed |
| Defense | 2.1 | own 26 | 23% caused |
CORE rating 33.9, 3rd of 136 (offense 18.9, defense -15.0).
A trip inside the 40 is a drive that reaches the opponent’s 40-yard line; points per trip is how many it scored on average (allowed, on defense). Average start is where drives began (the defense’s line is where its opponents started). Havoc is the share of plays ending in a tackle for loss, a forced fumble, an interception or a pass broken up. CORE is CollegeFootballData.com’s context- and opponent-adjusted rating (points better than an average team; lower is better on defense). From CollegeFootballData.com.
Leaders
| Passing yards | Fernando Mendoza QB | 3,535 yds |
| Passing touchdowns | Fernando Mendoza QB | 41 TD |
| Rushing yards | Roman Hemby RB | 1,120 yds |
| Rushing touchdowns | Kaelon Black RB | 10 TD |
| Receiving yards | Omar Cooper Jr. WR | 961 yds |
| Receiving touchdowns | Elijah Sarratt WR | 15 TD |
| Tackles | Rolijah Hardy LB | 103 tkl |
| Sacks | Rolijah Hardy LB | 8 sacks |
| Interceptions | Louis Moore DB | 5 INT |
Top recruits in the 2025 class
| Byron Baldwin Jr. S | ★★★★ | No. 258 |
| Triston Abram DE | ★★★ | No. 581 |
| Tyrone Burrus Jr. DE | ★★★ | No. 588 |
| Davion Chandler WR | ★★★ | No. 628 |
| Sean Cuono RB | ★★★ | No. 795 |
247Sports composite rankings via CollegeFootballData.com; national rank in the class.
The 2025 class by position
| Signed | Stars | Rating | |
|---|---|---|---|
| Quarterbacks | 2 | 2.5 | 0.808 |
| Running backs | 1 | 3.0 | 0.874 |
| Receivers | 5 | 3.0 | 0.865 |
| Offensive line | 4 | 2.8 | 0.838 |
| Defensive line | 5 | 3.0 | 0.871 |
| Linebackers | 3 | 3.0 | 0.861 |
| Defensive backs | 4 | 3.3 | 0.880 |
| Athletes and specialists | 2 | 3.0 | 0.834 |
| Whole class | 26 | 3.0 | 0.857 |
High-school signees by position group, with their average stars and 247Sports composite rating (out of 1), via CollegeFootballData.com. Athletes are signees with no set position.
Drafted in 2026
The 2026 draft| Rd 1 | Fernando Mendoza QB | Las Vegas Raiders |
| Rd 1 | Omar Cooper Jr. WR | New York Jets |
| Rd 2 | D’Angelo Ponds CB | New York Jets |
| Rd 3 | Kaelon Black RB | San Francisco 49ers |
| Rd 4 | Elijah Sarratt WR | Baltimore Ravens |
| Rd 5 | Riley Nowakowski TE | Pittsburgh Steelers |
| Rd 6 | Pat Coogan C | Tennessee Titans |
| Rd 7 | Aiden Fisher LB | Houston Texans |
Roster 106
The 2025 roster106 players, with numbers, heights, hometowns and each player’s 2025 line; 59 have a stat line. See the roster
Transfers in 23
The 2025 portal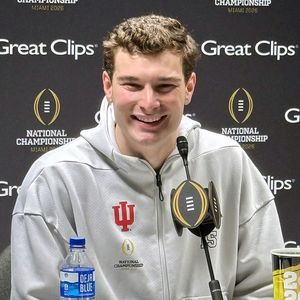 Fernando Mendoza QB | ★★★★ | from  California |
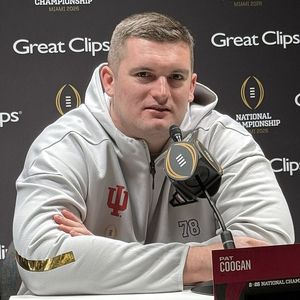 Pat Coogan OL | ★★★★ | from  Notre Dame |
 Amariyun Knighten CB | ★★★ | from  Northern Illinois |
 Holden Staes TE | ★★★ | from  Tennessee |
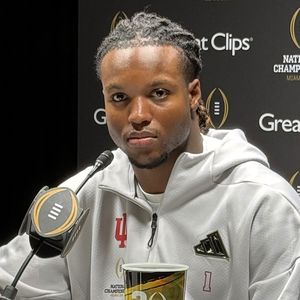 Roman Hemby RB | ★★★ | from  Maryland |
 Ryland Gandy CB | ★★★ | from  Pittsburgh |
 Tyler Morris WR | ★★★ | from  Michigan |
 Dominique Ratcliff DL | ★★★ | from  Texas State |
| Kellan Wyatt DE | ★★★ | from Maryland |
 Makai Jackson WR | ★★★ | from  App State |
 Stephen Daley DE | ★★★ | from  Kent State |
| Zen Michalski OT | ★★★ | from  Ohio State |
And 11 more, lower-rated or unrated.
Transfers out 27
 Donaven McCulley WR | ★★★ | to Michigan |
| Jamier Johnson CB | ★★★ | to  UCLA |
| Josh Philostin CB | ★★★ | to  Rhode Island |
| Tayven Jackson QB | ★★★ | to  UCF |
| Austin Barrett OT | ★★★ | to  Iowa State |
| Brody Foley TE | ★★★ | to  Tulsa |
| Marcus Burris Jr. DL | ★★★ | to  Memphis |
| Nahji Logan LB | ★★★ | to  Nevada |
| E.J. Williams WR | ★★★ | returned to  Indiana |
| Jamari Farmer LB | ★★★ | to  East Tennessee State |
| Sam West TE | ★★★ | to  Mississippi State |
| Elijah Green RB | ★★★ | to  Sam Houston |
And 15 more, lower-rated or unrated.
All-Big Ten
8 first team, 7 second teamFirst team
- Fernando MendozaQBCoaches-1; Media-1
- Carter SmithOTCoaches-1; Media-1
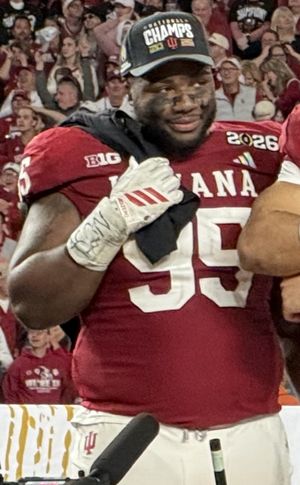 Tyrique TuckerDLCoaches-1; Media-1
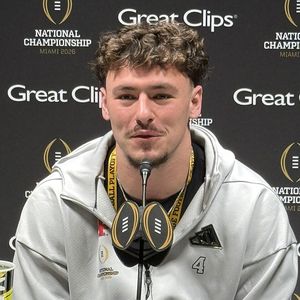 Aiden FisherLBCoaches-1; Media-1
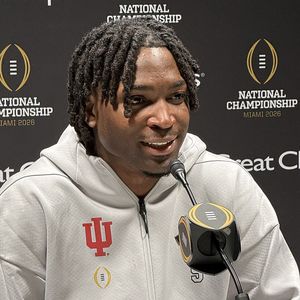 D’Angelo PondsDBCoaches-1; Media-1
- Louis MooreDBCoaches-1; Media-2
- Nico RadicicKCoaches-2; Media-1
- Mark LangstonLSCoaches-1; Media-1
Second team
- Omar Cooper Jr.WRCoaches-2; Media-2
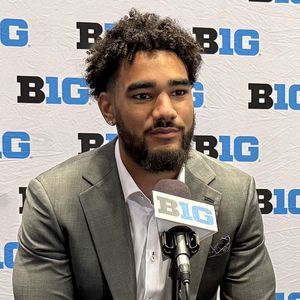 Elijah SarrattWRCoaches-2; Media-2
- Pat CooganCCoaches-3; Media-2
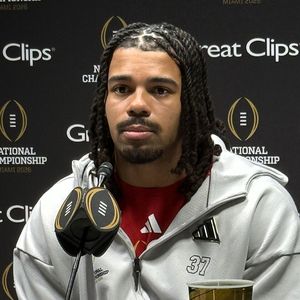 Riley NowakowskiTECoaches-3; Media-2
- Rolijah HardyLBCoaches-2; Media-2
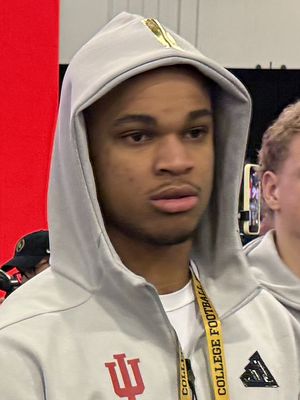 Amare FerrellDBMedia-2
- Jonathan BradyRSCoaches-2; Media-3
From Wikipedia’s 2025 all-conference team article, with the selectors that named each player (AP-1: the Associated Press’s first team).
2025 Big Ten standings
Conference page| Team | Conf. | Overall | AP final |
|---|---|---|---|
| Indiana | 9–0 | 16–0 | 1 |
| Ohio State | 9–0 | 12–2 | 5 |
| Oregon | 8–1 | 13–2 | 4 |
| Michigan | 7–2 | 9–4 | 21 |
 USC | 7–2 | 9–4 | 20 |
| Iowa | 6–3 | 9–4 | 17 |
| Illinois | 5–4 | 9–4 | |
 Washington | 5–4 | 9–4 | |
 Minnesota | 5–4 | 8–5 | |
 Nebraska | 4–5 | 7–6 | |
 Northwestern | 4–5 | 7–6 | |
| Penn State | 3–6 | 7–6 | |
| UCLA | 3–6 | 3–9 | |
 Rutgers | 2–7 | 5–7 | |
| Wisconsin | 2–7 | 4–8 | |
| Michigan State | 1–8 | 4–8 | |
| Maryland | 1–8 | 4–8 | |
| Purdue | 0–9 | 2–10 |
Ordered by conference winning percentage, then conference wins. Division splits and tiebreakers aren’t applied.