
2025 Baylor
5–7 (3–6 Big 12), coached by Dave Aranda. Share
Schedule and results
- Biggest upsetBeat No. 17 SMU 48–45Sep 6
SMU was ranked No. 17 and favored to win.
| Date | Opponent | Result | Elo |
|---|---|---|---|
| Aug 29 | vs Auburn | L 24–38 | 67% |
| Sep 6 | at 17SMU | W 48–45 | 28% |
| Sep 13 | vs Samford | W 42–7 | 91% |
| Sep 20 | vs Arizona State | L 24–27 | 48% |
| Sep 27 | at Oklahoma State | W 45–27 | 58% |
| Oct 4 | vs Kansas State | W 35–34 | 57% |
| Oct 18 | at TCU | L 36–42 | 35% |
| Oct 25 | at 21Cincinnati | L 20–41 | 39% |
| Nov 1 | vs UCF | W 30–3 | 64% |
| Nov 15 | vs 15Utah | L 28–55 | 43% |
| Nov 22 | at Arizona | L 17–41 | 35% |
| Nov 29 | vs Houston | L 24–31 | 54% |
Elo: a pregame chance from scores alone.
How it ended: Lost to Houston 31–24; unranked in the final AP poll; tied for 11th in the Big 12.
In program history: The 70th-best season in program history by end-of-season Elo (of 121 on file).
Led the nationKole Wilson: kickoff return yards (705 yds)
- Record
- 5–7
- Conference
- 3–6 tied for 11th in Big 12
- AP final
- Unranked
- Points
- 373–391
- Coach
- Dave Aranda
- Elo
- 1483 −79 this season
- SP+ rating
- 1.4 No. 71 of 136; offense No. 32, defense No. 110, special teams No. 1
- SRS
- 0.6 No. 67 of 136 in FBS
- Returning
- 83% of last season’s EPA, No. 5 of 134
- Recruiting class
- No. 36 roster talent No. 35 in FBS
- Offensive coordinator
- Jake Spavital
- Defensive coordinator
- Matt Powledge
- Offense
- Bear raid
- Defense
- 3–4
How good, play by play
| EPA per play | Success | Explosiveness | FBS rank | |
|---|---|---|---|---|
| Offense | 0.11 | 45% | 1.30 | 60th of 136 |
| Defense | 0.16 | 45% | 1.18 | 103rd of 136 |
| Opponent-adjusted | 0.14 off 0.13 def | 46% off 44% def | — | 41st off 86th def |
Passing and running
| Pass success | Depth of target | Deep throws | Line yards | Stuffed | |
|---|---|---|---|---|---|
| Offense | 46% | 8.9 yds | 15% | 3.10 | 15% |
| Defense | 44% | 9.3 yds | 13% | 3.30 | 12% |
How these are measured
Play-weighted averages over games against FBS opponents; raw numbers, not adjusted for the strength of the opponent. EPA (expected points added) measures how much each play changed the expected score; success rate counts plays that kept the offense on schedule; explosiveness is the average EPA on successful plays. Lower is better on defense. Ranked by EPA per play among teams that were FBS that season. The opponent-adjusted row (offense / defense) is CollegeFootballData.com’s WEPA, which accounts for who each team played. Passing and running: depth of target is how far downfield passes traveled in the air; deep throws are the share thrown deep, of the passes whose depth and direction the play-by-play describes (about half); line yards are the running yards per carry credited to the blockers; stuffed is the share of carries stopped at or behind the line. The defense’s line is what its opponents did. From CollegeFootballData.com, 2025 on.
Drives and havoc
| Points per trip inside the 40 | Average start | Havoc | |
|---|---|---|---|
| Offense | 3.7 | own 29 | 15% allowed |
| Defense | 4.3 | own 29 | 12% caused |
CORE rating -0.7, 69th of 136 (offense 4.8, defense 5.6).
A trip inside the 40 is a drive that reaches the opponent’s 40-yard line; points per trip is how many it scored on average (allowed, on defense). Average start is where drives began (the defense’s line is where its opponents started). Havoc is the share of plays ending in a tackle for loss, a forced fumble, an interception or a pass broken up. CORE is CollegeFootballData.com’s context- and opponent-adjusted rating (points better than an average team; lower is better on defense). From CollegeFootballData.com.
Leaders
| Passing yards | Sawyer Robertson QB | 3,681 yds |
| Passing touchdowns | Sawyer Robertson QB | 31 TD |
| Rushing yards | Bryson Washington RB | 788 yds |
| Rushing touchdowns | Bryson Washington RB | 6 TD |
| Receiving yards | Josh Cameron WR | 872 yds |
| Receiving touchdowns | Josh Cameron WR | 9 TD |
| Tackles | Keaton Thomas LB | 99 tkl |
| Sacks | Emar’Rion Winston DL | 4 sacks |
| Interceptions | Jacob Redding S | 3 INT |
Top recruits in the 2025 class
| Kaleb Burns LB | ★★★★ | No. 243 |
| Michael Turner RB | ★★★★ | No. 282 |
| Kamauryn Morgan DE | ★★★★ | No. 307 |
| Caden Knighten RB | ★★★★ | No. 474 |
| Taz Williams Jr. WR | ★★★ | No. 507 |
247Sports composite rankings via CollegeFootballData.com; national rank in the class.
The 2025 class by position
| Signed | Stars | Rating | |
|---|---|---|---|
| Quarterbacks | 1 | 3.0 | 0.867 |
| Running backs | 2 | 4.0 | 0.899 |
| Receivers | 5 | 3.0 | 0.866 |
| Offensive line | 2 | 3.0 | 0.863 |
| Defensive line | 3 | 3.3 | 0.883 |
| Linebackers | 3 | 3.3 | 0.876 |
| Defensive backs | 3 | 3.0 | 0.870 |
| Athletes and specialists | 2 | 3.0 | 0.845 |
| Whole class | 21 | 3.2 | 0.871 |
High-school signees by position group, with their average stars and 247Sports composite rating (out of 1), via CollegeFootballData.com. Athletes are signees with no set position.
Drafted in 2026
The 2026 draft| Rd 6 | Jackie Marshall DT | Tennessee Titans |
| Rd 6 | Josh Cameron WR | Jacksonville Jaguars |
Roster 117
The 2025 roster117 players, with numbers, heights, hometowns and each player’s 2025 line; 61 have a stat line. See the roster
Transfers in 23
The 2025 portal| Walker White QB | ★★★★ | from  Auburn |
 Kobe Prentice WR | ★★★ | from  Alabama |
 Emar’Rion Winston DE | ★★★ | from  Oregon |
 Calvin Simpson-Hunt CB | ★★★ | from  Ohio State |
 Devin Turner S | ★★★ | from  Northwestern |
 Adonis Friloux DL | ★★★ | from  Tulane |
 Caldra Williford CB | ★★★ | from  Tennessee Tech |
| Matthew Fobbs-White DE | ★★★ | from Tulane |
 Phoenix Jackson LB | ★★★ | from  Fresno State |
 Samu Taumanupepe DL | ★★★ | from  Texas A&M |
 Travion Barnes LB | ★★★ | from  Florida International |
| Tyler Turner S | ★★★ | from Oregon |
And 11 more, lower-rated or unrated.
Transfers out 17
 Corey Gordon S | ★★★ | to  Louisville |
| Brendan Bett DL | ★★★ | to  Florida |
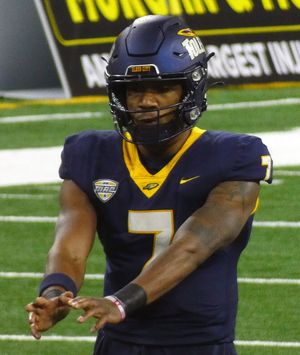 Dequan Finn QB | ★★★ | to  Miami (OH) |
| Alvin Ebosele OT | ★★★ | to  Houston |
| Richard Reese RB | ★★★ | to  Stephen F. Austin |
| Jaques Evans DE | ★★★ | to  Colorado State |
| Isaiah Dunson CB | ★★★★ | to  Georgia State |
| Kaian Roberts-Day DE | ★★★★ | to  UTSA |
| Cameron Bonner WR | ★★★ | to  Prairie View A&M |
| Carmello Jones DE | ★★★ | to  Jackson State |
| Josh Lair S | ★★★ | no new school on file |
| Romario Noel S | ★★★ | to  Abilene Christian |
And 5 more, lower-rated or unrated.
All-Big 12
5 first team, 2 second teamFirst team
- Omar AigbedionOLCoaches-1; Media-1
- Michael TriggTight ends/flexCoaches-1; Media-1
- Josh CameronWRCoaches-1; Media-2
- Palmer WilliamsPCoaches-1; Media-1
- Micah GiffordSpecialistsCoaches-1
Second team
- Sawyer RobertsonQBMedia-2
- Keaton ThomasLBCoaches-2; Media-2
From Wikipedia’s 2025 all-conference team article, with the selectors that named each player (AP-1: the Associated Press’s first team).
2025 Big 12 standings
Conference page| Team | Conf. | Overall | AP final |
|---|---|---|---|
 Texas Tech | 8–1 | 12–2 | 7 |
 BYU | 8–1 | 12–2 | 11 |
| Utah | 7–2 | 11–2 | 14 |
| Arizona | 7–3 | 9–4 | |
| Houston | 6–3 | 10–3 | 22 |
| Arizona State | 6–3 | 8–5 | |
| TCU | 5–4 | 9–4 | 25 |
 Iowa State | 5–4 | 8–4 | |
| Cincinnati | 5–4 | 7–6 | |
| Kansas State | 5–5 | 6–6 | |
| Baylor | 3–6 | 5–7 | |
 Kansas | 3–6 | 5–7 | |
| UCF | 2–7 | 5–7 | |
 West Virginia | 2–7 | 4–8 | |
 Colorado | 1–8 | 3–9 | |
| Oklahoma State | 0–9 | 1–11 |
Ordered by conference winning percentage, then conference wins. Division splits and tiebreakers aren’t applied.