
2025 Utah
11–2 (7–2 Big 12), coached by Kyle Whittingham, then Morgan Scalley (bowl game), finished No. 14 in the AP poll. Share
Schedule and results
- Best winBeat No. 17 Cincinnati 45–14Nov 1
Over the best-ranked team it beat, at home.
- Most excitingBeat Kansas State 51–47Nov 22
The win probability swung the most, by CollegeFootballData.com’s excitement index.
| Date | Opponent | Result | Elo |
|---|---|---|---|
| Aug 30 | at UCLA | W 43–10 | 43% |
| Sep 6 | vs Cal Poly | W 63–9 | 88% |
| Sep 13 | at Wyoming | W 31–6 | 55% |
| Sep 20 | vs 17Texas Tech | L 10–34 | 61% |
| Sep 27 | at West Virginia | W 48–14 | 48% |
| Oct 11 | vs 21Arizona State | W 42–10 | 49% |
| Oct 18 | at 15BYU | L 21–24 | 34% |
| Oct 25 | vs Colorado | W 53–7 | 68% |
| Nov 1 | vs 17Cincinnati | W 45–14 | 62% |
| Nov 15 | at Baylor | W 55–28 | 57% |
| Nov 22 | vs Kansas State | W 51–47 | 69% |
| Nov 28 | at Kansas | W 31–21 | 69% |
| Dec 31Bowls & playoff | vs NebraskaLas Vegas Bowl | W 44–22 | 75% |
Elo: a pregame chance from scores alone.
How it ended: Beat Nebraska 44–22 in the Las Vegas Bowl; No. 14 in the final AP poll; 3rd in the Big 12.
In program history: The 4th-best season in program history by end-of-season Elo (of 125 on file).
AP poll, week by week
- Wk 2: 25
- Wk 3: 20
- Wk 4: 16
- Wk 8: 23
- Wk 10: 24
- Wk 11: 17
- Wk 12: 15
- Wk 13: 13
- Wk 14: 14
- Wk 15: 15
- Wk 16: 15
- Final: 14
- Record
- 11–2
- Conference
- 7–2 3rd in Big 12
- AP final
- No. 14 peak No. 13
- Points
- 537–246
- Coach
- Kyle Whittingham, then Morgan Scalley (bowl game)
- Elo
- 1726 +215 this season
- SP+ rating
- 22.2 No. 8 of 136; offense No. 6, defense No. 17, special teams No. 74
- SRS
- 21.3 No. 7 of 136 in FBS
- Returning
- 14% of last season’s EPA, No. 114 of 134
- Recruiting class
- No. 40 roster talent No. 44 in FBS
- Offensive coordinator
- Jason Beck
- Defensive coordinator
- Morgan Scalley
- Offense
- Power spread
- Defense
- 4–2–5
How good, play by play
| EPA per play | Success | Explosiveness | FBS rank | |
|---|---|---|---|---|
| Offense | 0.29 | 48% | 1.28 | 4th of 136 |
| Defense | 0.03 | 39% | 1.35 | 33rd of 136 |
| Opponent-adjusted | 0.28 off 0.02 def | 49% off 38% def | — | 3rd off 34th def |
Passing and running
| Pass success | Depth of target | Deep throws | Line yards | Stuffed | |
|---|---|---|---|---|---|
| Offense | 48% | 11.5 yds | 21% | 3.50 | 12% |
| Defense | 36% | 11.2 yds | 26% | 3.20 | 17% |
How these are measured
Play-weighted averages over games against FBS opponents; raw numbers, not adjusted for the strength of the opponent. EPA (expected points added) measures how much each play changed the expected score; success rate counts plays that kept the offense on schedule; explosiveness is the average EPA on successful plays. Lower is better on defense. Ranked by EPA per play among teams that were FBS that season. The opponent-adjusted row (offense / defense) is CollegeFootballData.com’s WEPA, which accounts for who each team played. Passing and running: depth of target is how far downfield passes traveled in the air; deep throws are the share thrown deep, of the passes whose depth and direction the play-by-play describes (about half); line yards are the running yards per carry credited to the blockers; stuffed is the share of carries stopped at or behind the line. The defense’s line is what its opponents did. From CollegeFootballData.com, 2025 on.
Drives and havoc
| Points per trip inside the 40 | Average start | Havoc | |
|---|---|---|---|
| Offense | 5.0 | own 29 | 12% allowed |
| Defense | 2.9 | own 26 | 17% caused |
CORE rating 21.4, 11th of 136 (offense 15.1, defense -6.3).
A trip inside the 40 is a drive that reaches the opponent’s 40-yard line; points per trip is how many it scored on average (allowed, on defense). Average start is where drives began (the defense’s line is where its opponents started). Havoc is the share of plays ending in a tackle for loss, a forced fumble, an interception or a pass broken up. CORE is CollegeFootballData.com’s context- and opponent-adjusted rating (points better than an average team; lower is better on defense). From CollegeFootballData.com.
Leaders
| Passing yards | Devon Dampier QB | 2,490 yds |
| Passing touchdowns | Devon Dampier QB | 24 TD |
| Rushing yards | Wayshawn Parker RB | 981 yds |
| Rushing touchdowns | NaQuari Rogers RB | 11 TD |
| Receiving yards | Ryan Davis WR | 725 yds |
| Receiving touchdowns | Dallen Bentley TE | 6 TD |
| Tackles | Johnathan Hall LB | 63 tkl |
| Sacks | John Henry Daley DE | 11.5 sacks |
| Interceptions | Jackson Bennee S | 4 INT |
Top recruits in the 2025 class
| Cyrus Polu LB | ★★★★ | No. 473 |
| Christian Thatcher LB | ★★★ | No. 478 |
| Raycine Guillory Jr. RB | ★★★ | No. 478 |
| J.J. Buchanan ATH | ★★★ | No. 570 |
| Karson Kaufusi DL | ★★★ | No. 629 |
247Sports composite rankings via CollegeFootballData.com; national rank in the class.
The 2025 class by position
| Signed | Stars | Rating | |
|---|---|---|---|
| Quarterbacks | 2 | 3.0 | 0.873 |
| Running backs | 2 | 3.0 | 0.879 |
| Receivers | 3 | 3.0 | 0.869 |
| Offensive line | 4 | 3.0 | 0.851 |
| Defensive line | 4 | 3.0 | 0.865 |
| Linebackers | 3 | 3.3 | 0.883 |
| Defensive backs | 4 | 3.0 | 0.866 |
| Athletes and specialists | 3 | 3.0 | 0.857 |
| Whole class | 25 | 3.0 | 0.866 |
High-school signees by position group, with their average stars and 247Sports composite rating (out of 1), via CollegeFootballData.com. Athletes are signees with no set position.
Drafted in 2026
The 2026 draft| Rd 1 | Spencer Fano OT | Cleveland Browns |
| Rd 1 | Caleb Lomu OT | New England Patriots |
| Rd 7 | Dallen Bentley TE | Denver Broncos |
Roster 116
The 2025 roster116 players, with numbers, heights, hometowns and each player’s 2025 line; 58 have a stat line. See the roster
Transfers in 21
The 2025 portal Wayshawn Parker RB | ★★★★ | from  Washington State |
 Blake Cotton CB | ★★★ | from  UC Davis |
 Creed Whittemore WR | ★★★ | from  Mississippi State |
 Larry Simmons WR | ★★★ | from  Southern Miss |
 Devon Dampier QB | ★★★ | from  New Mexico |
 J.C. Hart CB | ★★★ | from  Auburn |
 Tobias Merriweather WR | ★★★ | from  California |
 Bryce Duke RB | ★★★ | from  Old Dominion |
 Dilan Battle DL | ★★★ | from  LSU |
 Lance Holtzclaw DE | ★★★ | from  Washington |
| NaQuari Rogers RB | ★★★ | from New Mexico |
 Otto Tia WR | ★★★ | from  Utah State |
And 9 more, lower-rated or unrated.
Transfers out 33
 Cameron Calhoun CB | ★★★★ | to  Alabama |
| Carsen Ryan TE | ★★★ | to  BYU |
| Anthony Woods RB | ★★★ | to  UCLA |
| Isaac Wilson QB | ★★★ | returned to  Utah |
| Keanu Tanuvasa DL | ★★★ | to BYU |
| Simonte Pepa DL | ★★★ | to Washington |
| Zach Williams WR | ★★★ | to  USC |
| Bear Tenney TE | ★★★ | to  Sacramento State |
| C.J. Blocker CB | ★★★ | to  Colorado State |
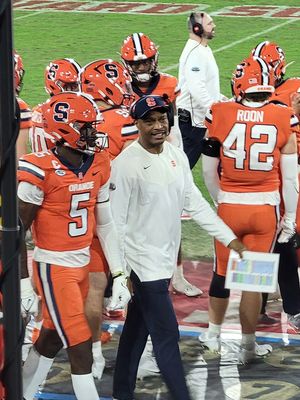 Damien Alford WR | ★★★ | to  Florida Atlantic |
| David Washington WR | ★★★ | to  Purdue |
| Jaylon Glover RB | ★★★ | to  UNLV |
And 21 more, lower-rated or unrated.
All-Big 12
3 first team, 2 second teamFirst team
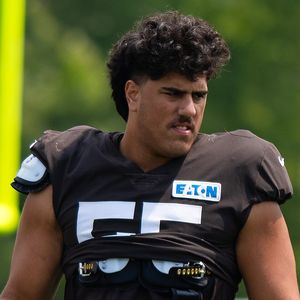 Spencer FanoOLCoaches-1; Media-1
- Caleb LomuOLCoaches-1; Media-1
- John Henry DaleyDLCoaches-1; Media-1
Second team
- Logan FanoDLCoaches-2
- Smith SnowdenDBCoaches-2
From Wikipedia’s 2025 all-conference team article, with the selectors that named each player (AP-1: the Associated Press’s first team).
2025 Big 12 standings
Conference page| Team | Conf. | Overall | AP final |
|---|---|---|---|
| Texas Tech | 8–1 | 12–2 | 7 |
| BYU | 8–1 | 12–2 | 11 |
| Utah | 7–2 | 11–2 | 14 |
 Arizona | 7–3 | 9–4 | |
 Houston | 6–3 | 10–3 | 22 |
| Arizona State | 6–3 | 8–5 | |
 TCU | 5–4 | 9–4 | 25 |
 Iowa State | 5–4 | 8–4 | |
| Cincinnati | 5–4 | 7–6 | |
| Kansas State | 5–5 | 6–6 | |
| Baylor | 3–6 | 5–7 | |
| Kansas | 3–6 | 5–7 | |
 UCF | 2–7 | 5–7 | |
| West Virginia | 2–7 | 4–8 | |
| Colorado | 1–8 | 3–9 | |
 Oklahoma State | 0–9 | 1–11 |
Ordered by conference winning percentage, then conference wins. Division splits and tiebreakers aren’t applied.