2024 Penn State
13–3 (8–1 Big Ten), coached by James Franklin, finished No. 5 in the AP poll. Share
Schedule and results
- Best winBeat No. 8 Boise State 31–14Dec 31
Over the best-ranked team it beat, at a neutral site.
- Most excitingLost to No. 3 Notre Dame 24–27Jan 9
The win probability swung the most, by CollegeFootballData.com’s excitement index.
| Date | Opponent | Result | Elo |
|---|---|---|---|
| Aug 31 | at West Virginia | W 34–12 | 51% |
| Sep 7 | vs Bowling Green | W 34–27 | 78% |
| Sep 21 | vs Kent State | W 56–0 | 93% |
| Sep 28 | vs 19Illinois | W 21–7 | 74% |
| Oct 5 | vs UCLA | W 27–11 | 82% |
| Oct 12 | at USC | W 33–30 | 58% |
| Oct 26 | at Wisconsin | W 28–13 | 58% |
| Nov 2 | vs 4Ohio State | L 13–20 | 57% |
| Nov 9 | vs Washington | W 35–6 | 67% |
| Nov 16 | at Purdue | W 49–10 | 86% |
| Nov 23 | at Minnesota | W 26–25 | 67% |
| Nov 30 | vs Maryland | W 44–7 | 89% |
| Dec 7 | vs 1OregonBig Ten Championship | L 37–45 | 39% |
| Dec 21Bowls & playoff | vs 12SMUCFP First Round | W 38–10 | 61% |
| Dec 31Bowls & playoff | vs 8Boise StateFiesta Bowl, CFP Quarterfinal | W 31–14 | 55% |
| Jan 9Bowls & playoff | vs 3Notre DameOrange Bowl, CFP Semifinal | L 24–27 | 42% |
Elo: a pregame chance from scores alone.
How it ended: Lost to Notre Dame 27–24 in the Orange Bowl, CFP Semifinal; No. 5 in the final AP poll; tied for 2nd in the Big Ten.
In program history: The 10th-best season in program history by end-of-season Elo (of 139 on file).
AP poll, week by week
- Wk 1: 8
- Wk 2: 8
- Wk 3: 8
- Wk 4: 10
- Wk 5: 9
- Wk 6: 7
- Wk 7: 4
- Wk 8: 3
- Wk 9: 3
- Wk 10: 3
- Wk 11: 6
- Wk 12: 4
- Wk 13: 4
- Wk 14: 4
- Wk 15: 3
- Wk 16: 5
- Final: 5
- Record
- 13–3
- Conference
- 8–1 tied for 2nd in Big Ten
- AP final
- No. 5 peak No. 3
- Points
- 530–264
- Coach
- James Franklin
- Elo
- 1780 +140 this season
- SP+ rating
- 24.6 No. 5 of 134; offense No. 9, defense No. 4, special teams No. 63
- SRS
- 19.3 No. 4 of 134 in FBS
- Returning
- 74% of last season’s EPA, No. 19 of 133
- Recruiting class
- No. 15 roster talent No. 11 in FBS
- Offensive coordinators
- Andy Kotelnicki, Ja’Juan Seider and Ty Howle
- Defensive coordinators
- Tom Allen and Anthony Poindexter
- Captains
- Drew Allar, Nick Dawkins, Dominic DeLuca, Kobe King, Riley Thompson and Kevin Winston Jr.
- Offense
- Pro spread
- Defense
- 4–2–5
How good, play by play
| EPA per play | Success | Explosiveness | FBS rank | |
|---|---|---|---|---|
| Offense | 0.26 | 50% | 1.21 | 8th of 134 |
| Defense | -0.01 | 38% | 1.23 | 12th of 134 |
| Opponent-adjusted | 0.25 off -0.03 def | 51% off 36% def | — | 7th off 5th def |
How these are measured
Play-weighted averages over games against FBS opponents; raw numbers, not adjusted for the strength of the opponent. EPA (expected points added) measures how much each play changed the expected score; success rate counts plays that kept the offense on schedule; explosiveness is the average EPA on successful plays. Lower is better on defense. Ranked by EPA per play among teams that were FBS that season. The opponent-adjusted row (offense / defense) is CollegeFootballData.com’s WEPA, which accounts for who each team played.
Drives and havoc
| Points per trip inside the 40 | Average start | Havoc | |
|---|---|---|---|
| Offense | 4.7 | own 29 | 10% allowed |
| Defense | 3.2 | own 27 | 19% caused |
CORE rating 27.1, 4th of 134 (offense 14.5, defense -12.7).
A trip inside the 40 is a drive that reaches the opponent’s 40-yard line; points per trip is how many it scored on average (allowed, on defense). Average start is where drives began (the defense’s line is where its opponents started). Havoc is the share of plays ending in a tackle for loss, a forced fumble, an interception or a pass broken up. CORE is CollegeFootballData.com’s context- and opponent-adjusted rating (points better than an average team; lower is better on defense). From CollegeFootballData.com.
Leaders
| Passing yards | Drew Allar QB | 3,327 yds |
| Passing touchdowns | Drew Allar QB | 24 TD |
| Rushing yards | Kaytron Allen RB | 1,108 yds |
| Rushing touchdowns | Nicholas Singleton RB | 12 TD |
| Receiving yards | Tyler Warren TE | 1,233 yds |
| Receiving touchdowns | Tyler Warren TE | 8 TD |
| Tackles | Jaylen Reed S | 95 tkl |
| Sacks | Abdul Carter DE | 12 sacks |
| Interceptions | Dominic DeLuca LB | 3 INT |
Top recruits in the 2024 class
| Cooper Cousins OL | ★★★★ | No. 57 |
| Luke Reynolds TE | ★★★★ | No. 71 |
| Quinton Martin Jr. RB | ★★★★ | No. 89 |
| Ethan Grunkemeyer QB | ★★★★ | No. 105 |
| Liam Andrews DL | ★★★★ | No. 125 |
| Jon Mitchell CB | ★★★★ | No. 128 |
| Garrett Sexton OT | ★★★★ | No. 210 |
| Mylachi Williams DE | ★★★★ | No. 281 |
247Sports composite rankings via CollegeFootballData.com; national rank in the class.
The 2024 class by position
| Signed | Stars | Rating | |
|---|---|---|---|
| Quarterbacks | 1 | 4.0 | 0.951 |
| Running backs | 2 | 4.0 | 0.927 |
| Receivers | 4 | 3.5 | 0.907 |
| Offensive line | 4 | 3.8 | 0.919 |
| Defensive line | 7 | 3.6 | 0.897 |
| Linebackers | 2 | 3.5 | 0.888 |
| Defensive backs | 5 | 3.6 | 0.901 |
| Athletes and specialists | 1 | 3.0 | 0.883 |
| Whole class | 26 | 3.6 | 0.906 |
High-school signees by position group, with their average stars and 247Sports composite rating (out of 1), via CollegeFootballData.com. Athletes are signees with no set position.
Drafted in 2025
The 2025 draft| Rd 1 | Abdul Carter DE | New York Giants |
| Rd 1 | Tyler Warren TE | Indianapolis Colts |
| Rd 3 | Kevin Winston Jr. S | Tennessee Titans |
| Rd 6 | Jaylen Reed S | Houston Texans |
| Rd 6 | Kobe King LB | Minnesota Vikings |
Roster 125
The 2024 roster125 players, with numbers, heights, hometowns and each player’s 2024 line; 67 have a stat line. See the roster
Transfers in 6
The 2024 portal A.J. Harris CB | ★★★★ | from  Georgia |
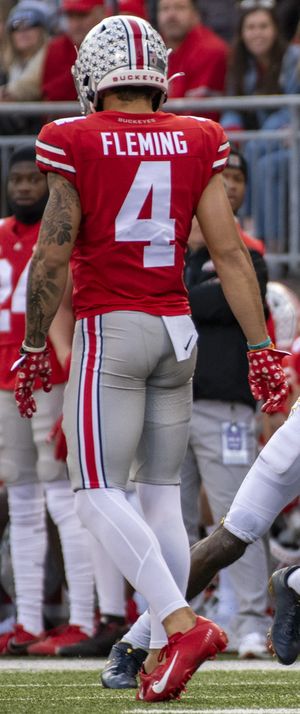 Julian Fleming WR | ★★★★ | from  Ohio State |
| Nolan Rucci OT | ★★★ | from  Wisconsin |
 Jalen Kimber CB | ★★★ | from  Florida |
| Jordan Mayer DE | ★★★ | from Wisconsin |
 Chase Meyer K | from  Tulsa |
Transfers out 13
 Keandre Lambert WR | ★★★★ | to  Auburn |
| King Mack S | ★★★★ | to  Alabama |
| Dante Cephas WR | ★★★ | to  Kansas State |
| Cristian Driver WR | ★★★ | to  Minnesota |
| Jordan van den Berg DL | ★★★ | to  Georgia Tech |
| London Montgomery RB | ★★★ | to  East Carolina |
| Malik McClain WR | ★★★ | to  Arizona State |
| Davon Townley Jr. DL | ★★★ | to  Missouri State |
| Alex Bacchetta P | ★★★ | to  Rice |
| Golden Israel-Achumba OL | ★★★ | no new school on file |
| Ibrahim Traore OT | ★★★ | no new school on file |
| Malick Meiga WR | ★★★ | to  Coastal Carolina |
And 1 more, lower-rated or unrated.
All-Big Ten
2 first team, 3 second teamFirst team
 Tyler WarrenTECoaches-1; Media-1
- Abdul CarterDLCoaches-1; Media-1
Second team
- Olaivavega IoaneOGCoaches-2; Media-2
- Kobe KingLBCoaches-2; Media-2
- Jaylen ReedDBCoaches-2; Media-2
From Wikipedia’s 2024 all-conference team article, with the selectors that named each player (AP-1: the Associated Press’s first team).
2024 Big Ten standings
Conference page| Team | Conf. | Overall | AP final |
|---|---|---|---|
| Oregon | 9–0 | 13–1 | 3 |
 Indiana | 8–1 | 11–2 | 10 |
| Penn State | 8–1 | 13–3 | 5 |
| Ohio State | 7–2 | 14–2 | 1 |
| Illinois | 6–3 | 10–3 | 16 |
 Iowa | 6–3 | 8–5 | |
 Michigan | 5–4 | 8–5 | |
| Minnesota | 5–4 | 8–5 | |
| USC | 4–5 | 7–6 | |
 Rutgers | 4–5 | 7–6 | |
| Washington | 4–5 | 6–7 | |
 Nebraska | 3–6 | 7–6 | |
 Michigan State | 3–6 | 5–7 | |
| Wisconsin | 3–6 | 5–7 | |
| UCLA | 3–6 | 5–7 | |
 Northwestern | 2–7 | 4–8 | |
| Maryland | 1–8 | 4–8 | |
| Purdue | 0–9 | 1–11 |
Ordered by conference winning percentage, then conference wins. Division splits and tiebreakers aren’t applied.