2024 Minnesota
8–5 (5–4 Big Ten), coached by P.J. Fleck. Share
Schedule and results
- Biggest upsetBeat No. 11 USC 24–17Oct 5
USC was ranked No. 11 and favored to win.
- Most excitingBeat No. 24 Illinois 25–17Nov 2
The win probability swung the most, by CollegeFootballData.com’s excitement index.
| Date | Opponent | Result | Elo |
|---|---|---|---|
| Aug 29 | vs North Carolina | L 17–19 | 55% |
| Sep 7 | vs Rhode Island | W 48–0 | 77% |
| Sep 14 | vs Nevada | W 27–0 | 79% |
| Sep 21 | vs Iowa | L 14–31 | 47% |
| Sep 28 | at 12Michigan | L 24–27 | 15% |
| Oct 5 | vs 11USC | W 24–17 | 41% |
| Oct 12 | at UCLA | W 21–17 | 49% |
| Oct 26 | vs Maryland | W 48–23 | 60% |
| Nov 2 | at 24Illinois | W 25–17 | 42% |
| Nov 9 | at Rutgers | L 19–26 | 62% |
| Nov 23 | vs 4Penn State | L 25–26 | 33% |
| Nov 29 | at Wisconsin | W 24–7 | 48% |
| Jan 3Bowls & playoff | vs Virginia TechDuke’s Mayo Bowl | W 24–10 | 53% |
Elo: a pregame chance from scores alone.
How it ended: Beat Virginia Tech 24–10 in the Duke’s Mayo Bowl; unranked in the final AP poll; tied for 7th in the Big Ten.
In program history: The 33rd-best season in program history by end-of-season Elo (of 135 on file).
- Record
- 8–5
- Conference
- 5–4 tied for 7th in Big Ten
- AP final
- Unranked
- Points
- 340–220
- Coach
- P.J. Fleck
- Elo
- 1618 +103 this season
- SP+ rating
- 10.4 No. 27 of 134; offense No. 79, defense No. 11, special teams No. 63
- SRS
- 12.6 No. 19 of 134 in FBS
- Returning
- 55% of last season’s EPA, No. 53 of 133
- Recruiting class
- No. 37 roster talent No. 45 in FBS
- Offensive coordinators
- Matt Simon and Greg Harbaugh Jr.
- Defensive coordinators
- Corey Hetherman and Nick Monroe
- Offense
- Multiple
- Defense
- 4–3
How good, play by play
| EPA per play | Success | Explosiveness | FBS rank | |
|---|---|---|---|---|
| Offense | 0.14 | 43% | 1.20 | 46th of 134 |
| Defense | 0.01 | 39% | 1.19 | 20th of 134 |
| Opponent-adjusted | 0.15 off 0.01 def | 44% off 38% def | — | 46th off 16th def |
How these are measured
Play-weighted averages over games against FBS opponents; raw numbers, not adjusted for the strength of the opponent. EPA (expected points added) measures how much each play changed the expected score; success rate counts plays that kept the offense on schedule; explosiveness is the average EPA on successful plays. Lower is better on defense. Ranked by EPA per play among teams that were FBS that season. The opponent-adjusted row (offense / defense) is CollegeFootballData.com’s WEPA, which accounts for who each team played.
Drives and havoc
| Points per trip inside the 40 | Average start | Havoc | |
|---|---|---|---|
| Offense | 4.3 | own 28 | 16% allowed |
| Defense | 3.2 | own 29 | 20% caused |
CORE rating 13.3, 23rd of 134 (offense 1.8, defense -11.5).
A trip inside the 40 is a drive that reaches the opponent’s 40-yard line; points per trip is how many it scored on average (allowed, on defense). Average start is where drives began (the defense’s line is where its opponents started). Havoc is the share of plays ending in a tackle for loss, a forced fumble, an interception or a pass broken up. CORE is CollegeFootballData.com’s context- and opponent-adjusted rating (points better than an average team; lower is better on defense). From CollegeFootballData.com.
Leaders
| Passing yards | Max Brosmer QB | 2,829 yds |
| Passing touchdowns | Max Brosmer QB | 18 TD |
| Rushing yards | Darius Taylor RB | 986 yds |
| Rushing touchdowns | Darius Taylor RB | 10 TD |
| Receiving yards | Daniel Jackson WR | 863 yds |
| Receiving touchdowns | Elijah Spencer WR | 6 TD |
| Tackles | Cody Lindenberg LB | 94 tkl |
| Sacks | Anthony Smith DL | 6 sacks |
| Interceptions | Koi Perich DB | 5 INT |
Top recruits in the 2024 class
| Koi Perich S | ★★★★ | No. 70 |
| Nathan Roy OL | ★★★★ | No. 183 |
| Riley Sunram DL | ★★★★ | No. 452 |
| Brett Carroll OL | ★★★ | No. 630 |
| Julian Johnson ATH | ★★★ | No. 680 |
247Sports composite rankings via CollegeFootballData.com; national rank in the class.
The 2024 class by position
| Signed | Stars | Rating | |
|---|---|---|---|
| Quarterbacks | 2 | 2.5 | 0.821 |
| Running backs | 2 | 3.0 | 0.862 |
| Receivers | 3 | 3.0 | 0.869 |
| Offensive line | 2 | 3.5 | 0.903 |
| Defensive line | 4 | 3.3 | 0.870 |
| Linebackers | 2 | 3.0 | 0.852 |
| Defensive backs | 7 | 2.7 | 0.835 |
| Athletes and specialists | 2 | 3.0 | 0.873 |
| Whole class | 24 | 3.0 | 0.856 |
High-school signees by position group, with their average stars and 247Sports composite rating (out of 1), via CollegeFootballData.com. Athletes are signees with no set position.
Drafted in 2025
The 2025 draft| Rd 2 | Aireontae Ersery OT | Houston Texans |
| Rd 3 | Justin Walley CB | Indianapolis Colts |
| Rd 7 | Cody Lindenberg LB | Las Vegas Raiders |
Roster 115
The 2024 roster115 players, with numbers, heights, hometowns and each player’s 2024 line; 59 have a stat line. See the roster
Transfers in 12
The 2024 portal Jaxon Howard DE | ★★★★ | from  LSU |
 Tyler Williams WR | ★★★★ | from  Georgia |
 Max Brosmer QB | ★★★★ | from  New Hampshire |
 Sieh Bangura RB | ★★★ | from  Ohio |
 Adam Kissayi DE | ★★★ | from  Clemson |
 Ethan Robinson CB | ★★★ | from  Bucknell |
| Cristian Driver WR | ★★★ | from  Penn State |
 Aluma Nkele OT | ★★★ | from  UTEP |
 Jaren Mangham RB | ★★★ | from  Michigan State |
 Marcus Major RB | ★★★ | from  Oklahoma |
| Dylan Wittke QB | ★★★ | from  Virginia Tech |
 Jaionte McMillan CB | ★★★ | from  TCU |
Transfers out 18
 Zach Evans RB | ★★★ | to  North Texas |
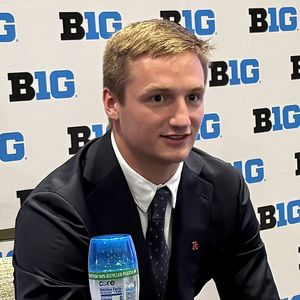 Athan Kaliakmanis QB | ★★★ | to  Rutgers |
| Jaylen Varner WR | ★★★ | no new school on file |
| Marquese Williams RB | ★★★ | to  Akron |
| Drew Viotto QB | ★★★ | to  Eastern Michigan |
| Tariq Watson CB | ★★★ | to  UAB |
| Dino Kaliakmanis WR | ★★★ | to Rutgers |
| Trey Bixby DL | ★★★★ | to Minnesota Duluth |
| Cade McConnell OL | ★★★ | to  Vanderbilt |
| Dallas Sims WR | ★★★ | to  Old Dominion |
| De’Eric Mister OT | ★★★ | to  Howard |
| J.J. Guedet OT | ★★★ | to  Illinois State |
And 6 more, lower-rated or unrated.
All-Big Ten
3 first team, 1 second teamFirst team
- Aireontae ErseryOTCoaches-1; Media-1
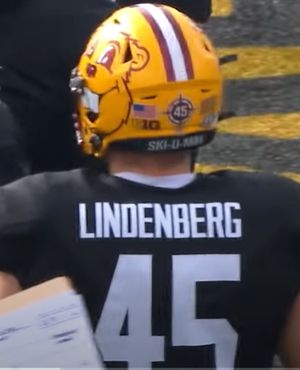 Cody LindenbergLBCoaches-1; Media-2
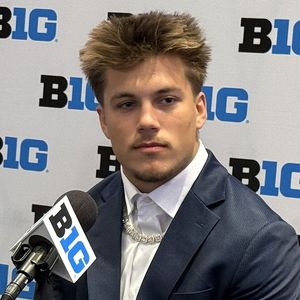 Koi PerichDBCoaches-1; Media-1
Second team
- Justin WalleyDBCoaches-2
From Wikipedia’s 2024 all-conference team article, with the selectors that named each player (AP-1: the Associated Press’s first team).
2024 Big Ten standings
Conference page| Team | Conf. | Overall | AP final |
|---|---|---|---|
 Oregon | 9–0 | 13–1 | 3 |
 Indiana | 8–1 | 11–2 | 10 |
| Penn State | 8–1 | 13–3 | 5 |
 Ohio State | 7–2 | 14–2 | 1 |
| Illinois | 6–3 | 10–3 | 16 |
| Iowa | 6–3 | 8–5 | |
| Michigan | 5–4 | 8–5 | |
| Minnesota | 5–4 | 8–5 | |
| USC | 4–5 | 7–6 | |
| Rutgers | 4–5 | 7–6 | |
 Washington | 4–5 | 6–7 | |
 Nebraska | 3–6 | 7–6 | |
| Michigan State | 3–6 | 5–7 | |
| Wisconsin | 3–6 | 5–7 | |
| UCLA | 3–6 | 5–7 | |
 Northwestern | 2–7 | 4–8 | |
| Maryland | 1–8 | 4–8 | |
 Purdue | 0–9 | 1–11 |
Ordered by conference winning percentage, then conference wins. Division splits and tiebreakers aren’t applied.