2022 USC
11–3 (8–1 Pac-12), coached by Lincoln Riley, finished No. 12 in the AP poll. Share
Schedule and results
- Best winBeat No. 13 Notre Dame 38–27Nov 26
Over the best-ranked team it beat, at home.
- Most excitingBeat No. 16 UCLA 48–45Nov 19
The win probability swung the most, by CollegeFootballData.com’s excitement index.
| Date | Opponent | Result | Elo |
|---|---|---|---|
| Sep 3 | vs Rice | W 66–14 | 67% |
| Sep 10 | at Stanford | W 41–28 | 50% |
| Sep 17 | vs Fresno State | W 45–17 | 52% |
| Sep 24 | at Oregon State | W 17–14 | 37% |
| Oct 1 | vs Arizona State | W 42–25 | 70% |
| Oct 8 | vs Washington State | W 30–14 | 58% |
| Oct 15 | at 20Utah | L 42–43 | 34% |
| Oct 29 | at Arizona | W 45–37 | 71% |
| Nov 5 | vs California | W 41–35 | 79% |
| Nov 11 | vs Colorado | W 55–17 | 88% |
| Nov 19 | at 16UCLA | W 48–45 | 44% |
| Nov 26 | vs 13Notre Dame | W 38–27 | 46% |
| Dec 2 | vs12UtahPac-12 Championship Game | L 24–47 | 47% |
| Jan 2Bowls & playoff | vs 14TulaneCotton Bowl | L 45–46 | 50% |
Elo: a pregame chance from scores alone.
How it ended: Lost to Tulane 46–45 in the Cotton Bowl; No. 12 in the final AP poll; first in the Pac-12.
In program history: The 59th-best season in program history by end-of-season Elo (of 112 on file).
AP poll, week by week
- Wk 1: 14
- Wk 2: 10
- Wk 3: 7
- Wk 4: 7
- Wk 5: 6
- Wk 6: 6
- Wk 7: 7
- Wk 8: 12
- Wk 9: 10
- Wk 10: 9
- Wk 11: 8
- Wk 12: 7
- Wk 13: 5
- Wk 14: 4
- Wk 15: 8
- Final: 12
Pac-12 South champions8–1 in the conference, shared with Utah
Led the nationCaleb Williams: passing touchdowns (42 TD)
Heisman TrophyCaleb Williams, QB; also the Maxwell and Walter Camp
2 consensus All-AmericansCaleb Williams, QB; Tuli Tuipulotu, DL
- Record
- 11–3
- Conference
- 8–1 first in Pac-12
- AP final
- No. 12 peak No. 4
- Points
- 579–409
- Coach
- Lincoln Riley
- Elo
- 1639 +169 this season
- SP+ rating
- 18.9 No. 11 of 131; offense No. 2, defense No. 63, special teams No. 116
- SRS
- 11.5 No. 19 of 131 in FBS
- Returning
- 22% of last season’s EPA, No. 120 of 130
- Recruiting class
- No. 70 roster talent No. 11 in FBS
- Offensive coordinator
- Josh Henson
- Defensive coordinator
- Alex Grinch
- Captains
- Caleb Williams, Justin Dedich, Tuli Tuipulotu and Shane Lee
- Offense
- Air raid
- Defense
- 3–4
How good, play by play
| EPA per play | Success | Explosiveness | FBS rank | |
|---|---|---|---|---|
| Offense | 0.38 | 52% | 1.34 | 1st of 131 |
| Defense | 0.18 | 48% | 1.31 | 105th of 131 |
| Opponent-adjusted | 0.32 off 0.15 def | 50% off 46% def | — | 2nd off 102nd def |
How these are measured
Play-weighted averages over games against FBS opponents; raw numbers, not adjusted for the strength of the opponent. EPA (expected points added) measures how much each play changed the expected score; success rate counts plays that kept the offense on schedule; explosiveness is the average EPA on successful plays. Lower is better on defense. Ranked by EPA per play among teams that were FBS that season. The opponent-adjusted row (offense / defense) is CollegeFootballData.com’s WEPA, which accounts for who each team played.
Drives and havoc
| Points per trip inside the 40 | Average start | Havoc | |
|---|---|---|---|
| Offense | 4.7 | own 28 | 11% allowed |
| Defense | 4.5 | own 27 | 17% caused |
CORE rating 7.2, 38th of 131 (offense 17.7, defense 10.5).
A trip inside the 40 is a drive that reaches the opponent’s 40-yard line; points per trip is how many it scored on average (allowed, on defense). Average start is where drives began (the defense’s line is where its opponents started). Havoc is the share of plays ending in a tackle for loss, a forced fumble, an interception or a pass broken up. CORE is CollegeFootballData.com’s context- and opponent-adjusted rating (points better than an average team; lower is better on defense). From CollegeFootballData.com.
Leaders
| Passing yards | Caleb Williams QB | 4,535 yds |
| Passing touchdowns | Caleb Williams QB | 42 TD |
| Rushing yards | Travis Dye RB | 884 yds |
| Rushing touchdowns | Caleb Williams QB | 10 TD |
| Receiving yards | Jordan Addison WR | 875 yds |
| Receiving touchdowns | Jordan Addison WR | 8 TD |
| Tackles | Shane Lee LB | 68 tkl |
| Sacks | Tuli Tuipulotu DL | 13.5 sacks |
| Interceptions | Calen Bullock S | 5 INT |
Top recruits in the 2022 class
| Domani Jackson CB | ★★★★★ | No. 5 |
| Raleek Brown RB | ★★★★ | No. 42 |
| Zion Branch S | ★★★★ | No. 58 |
| C.J. Williams WR | ★★★★ | No. 73 |
| Fabian Ross CB | ★★★★ | No. 246 |
247Sports composite rankings via CollegeFootballData.com; national rank in the class.
The 2022 class by position
| Signed | Stars | Rating | |
|---|---|---|---|
| Running backs | 1 | 4.0 | 0.981 |
| Receivers | 2 | 3.5 | 0.895 |
| Defensive line | 1 | 3.0 | 0.876 |
| Linebackers | 1 | 3.0 | 0.864 |
| Defensive backs | 3 | 4.3 | 0.961 |
| Athletes and specialists | 1 | 3.0 | 0.811 |
| Whole class | 9 | 3.7 | 0.912 |
High-school signees by position group, with their average stars and 247Sports composite rating (out of 1), via CollegeFootballData.com. Athletes are signees with no set position.
Drafted in 2023
The 2023 draft| Rd 1 | Jordan Addison WR | Minnesota Vikings |
| Rd 2 | Tuli Tuipulotu OLB | Los Angeles Chargers |
| Rd 3 | Mekhi Blackmon CB | Minnesota Vikings |
| Rd 7 | Andrew Vorhees OG | Baltimore Ravens |
Roster 110
The 2022 roster110 players, with numbers, heights, hometowns and each player’s 2022 line; 57 have a stat line. See the roster
Transfers in 20
The 2022 portal Caleb Williams QB | ★★★★★ | from  Oklahoma |
 Jordan Addison WR | ★★★★★ | from  Pittsburgh |
 Mario Williams WR | ★★★★ | from Oklahoma |
 Eric Gentry LB | ★★★★ | from  Arizona State |
 Travis Dye RB | ★★★★ | from  Oregon |
| Brenden Rice WR | ★★★★ | from  Colorado |
| Latrell McCutchin CB | ★★★★ | from Oklahoma |
| Austin Jones RB | ★★★ | from  Stanford |
 Bryson Shaw S | ★★★ | from  Ohio State |
 Romello Height LB | ★★★ | from  Auburn |
 Bobby Haskins OT | ★★★ | from  Virginia |
 Jacobe Covington CB | ★★★ | from  Washington |
And 8 more, lower-rated or unrated.
Transfers out 27
 Jaxson Dart QB | ★★★★ | to  Ole Miss |
 Michael Trigg TE | ★★★★ | to Ole Miss |
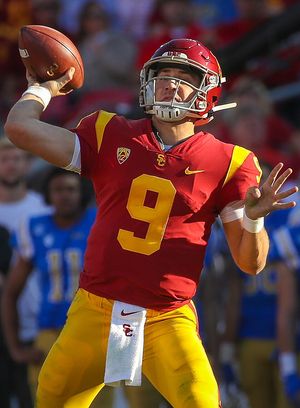 Kedon Slovis QB | ★★★★ | to Pittsburgh |
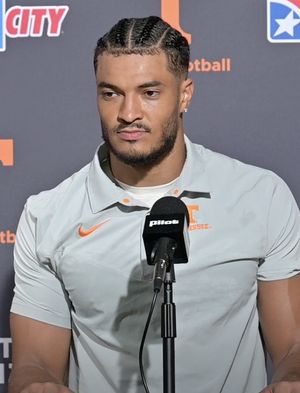 Bru McCoy WR | ★★★★ | to  Tennessee |
| Brandon Campbell RB | ★★★ | to  Houston |
| Jake Lichtenstein DL | ★★★ | to  Miami |
| Raymond Scott LB | ★★★ | to  Fresno State |
| Casey Collier OT | ★★★ | to  Oklahoma State |
| Joseph Manjack WR | ★★★ | to Houston |
| Chase Williams S | ★★★ | to  San José State |
| Hunter Echols DE | ★★★ | to  Arizona |
| Jayden Williams CB | ★★★ | to  Louisville |
And 15 more, lower-rated or unrated.
2022 Pac-12 standings
| Team | Conf. | Overall | AP final |
|---|---|---|---|
| USC | 8–1 | 11–3 | 12 |
| Washington | 7–2 | 11–2 | 8 |
| Oregon | 7–2 | 10–3 | 15 |
| Utah | 7–2 | 10–4 | 10 |
| Oregon State | 6–3 | 10–3 | 17 |
| UCLA | 6–3 | 9–4 | 21 |
| Washington State | 4–5 | 7–6 | |
| Arizona | 3–6 | 5–7 | |
| California | 2–7 | 4–8 | |
| Arizona State | 2–7 | 3–9 | |
| Stanford | 1–8 | 3–9 | |
| Colorado | 1–8 | 1–11 |
Ordered by conference winning percentage, then conference wins. Division splits and tiebreakers aren’t applied.