
2023 USC
8–5 (5–4 Pac-12), coached by Lincoln Riley. Share
Schedule and results
- Biggest upsetBeat No. 16 Louisville 42–28Dec 27
Louisville was ranked No. 16 and favored to win.
- Most excitingBeat Arizona 43–41Oct 7
The win probability swung the most, by CollegeFootballData.com’s excitement index.
| Date | Opponent | Result | Elo |
|---|---|---|---|
| Aug 26 | vs San José State | W 56–28 | 71% |
| Sep 2 | vs Nevada | W 66–14 | 83% |
| Sep 9 | vs Stanford | W 56–10 | 81% |
| Sep 23 | at Arizona State | W 42–28 | 73% |
| Sep 30 | at Colorado | W 48–41 | 72% |
| Oct 7 | vs Arizona | W 43–41 | 81% |
| Oct 14 | at 21Notre Dame | L 20–48 | 40% |
| Oct 21 | vs 14Utah | L 32–34 | 53% |
| Oct 28 | at California | W 50–49 | 65% |
| Nov 4 | vs 5Washington | L 42–52 | 45% |
| Nov 11 | at 6Oregon | L 27–36 | 27% |
| Nov 18 | vs UCLA | L 20–38 | 62% |
| Dec 27Bowls & playoff | vs 16LouisvilleHoliday Bowl | W 42–28 | 39% |
Elo: a pregame chance from scores alone.
How it ended: Beat Louisville 42–28 in the Holiday Bowl; unranked in the final AP poll; tied for 4th in the Pac-12.
In program history: The 75th-best season in program history by end-of-season Elo (of 112 on file).
AP poll, week by week
- Wk 1: 6
- Wk 2: 6
- Wk 3: 5
- Wk 4: 5
- Wk 5: 8
- Wk 6: 9
- Wk 7: 10
- Wk 8: 18
- Wk 9: 24
- Wk 10: 24
Led the nationZachariah Branch: punt return average (20.8)
- Record
- 8–5
- Conference
- 5–4 tied for 4th in Pac-12
- AP final
- Unranked peak No. 5
- Points
- 544–447
- Coach
- Lincoln Riley
- Elo
- 1594 +2 this season
- SP+ rating
- 9.4 No. 29 of 133; offense No. 3, defense No. 105, special teams No. 99
- SRS
- 10.5 No. 22 of 133 in FBS
- Returning
- 74% of last season’s EPA, No. 24 of 131
- Recruiting class
- No. 8 roster talent No. 8 in FBS
- Offensive coordinator
- Josh Henson
- Defensive coordinators
- Alex Grinch, Shaun Nua and Brian Odom
- Captains
- Caleb Williams, Justin Dedich, Shane Lee, Jonah Monheim and Mason Cobb
- Offense
- Air raid
- Defense
- 3–4
How good, play by play
| EPA per play | Success | Explosiveness | FBS rank | |
|---|---|---|---|---|
| Offense | 0.30 | 48% | 1.50 | 5th of 133 |
| Defense | 0.19 | 45% | 1.34 | 104th of 133 |
| Opponent-adjusted | 0.28 off 0.16 def | 48% off 43% def | — | 4th off 101st def |
How these are measured
Play-weighted averages over games against FBS opponents; raw numbers, not adjusted for the strength of the opponent. EPA (expected points added) measures how much each play changed the expected score; success rate counts plays that kept the offense on schedule; explosiveness is the average EPA on successful plays. Lower is better on defense. Ranked by EPA per play among teams that were FBS that season. The opponent-adjusted row (offense / defense) is CollegeFootballData.com’s WEPA, which accounts for who each team played.
Drives and havoc
| Points per trip inside the 40 | Average start | Havoc | |
|---|---|---|---|
| Offense | 5.0 | own 30 | 16% allowed |
| Defense | 3.5 | own 31 | 15% caused |
CORE rating 8.3, 35th of 133 (offense 14.9, defense 6.5).
A trip inside the 40 is a drive that reaches the opponent’s 40-yard line; points per trip is how many it scored on average (allowed, on defense). Average start is where drives began (the defense’s line is where its opponents started). Havoc is the share of plays ending in a tackle for loss, a forced fumble, an interception or a pass broken up. CORE is CollegeFootballData.com’s context- and opponent-adjusted rating (points better than an average team; lower is better on defense). From CollegeFootballData.com.
Leaders
| Passing yards | Caleb Williams QB | 3,633 yds |
| Passing touchdowns | Caleb Williams QB | 30 TD |
| Rushing yards | MarShawn Lloyd RB | 820 yds |
| Rushing touchdowns | Caleb Williams QB | 11 TD |
| Receiving yards | Tahj Washington WR | 1,062 yds |
| Receiving touchdowns | Brenden Rice WR | 12 TD |
| Tackles | Mason Cobb LB | 85 tkl |
| Sacks | Jamil Muhammad DE | 5.5 sacks |
| Interceptions | Calen Bullock S | 2 INT |
Top recruits in the 2023 class
| Zachariah Branch WR | ★★★★★ | No. 4 |
| Malachi Nelson QB | ★★★★★ | No. 12 |
| Duce Robinson TE | ★★★★★ | No. 17 |
| Makai Lemon WR | ★★★★ | No. 44 |
| Braylan Shelby DE | ★★★★ | No. 86 |
| Tackett Curtis LB | ★★★★ | No. 109 |
| Walker Lyons TE | ★★★★ | No. 126 |
| Quinten Joyner RB | ★★★★ | No. 186 |
247Sports composite rankings via CollegeFootballData.com; national rank in the class.
The 2023 class by position
| Signed | Stars | Rating | |
|---|---|---|---|
| Quarterbacks | 1 | 5.0 | 0.995 |
| Running backs | 3 | 3.7 | 0.881 |
| Receivers | 5 | 4.4 | 0.961 |
| Offensive line | 5 | 3.2 | 0.890 |
| Defensive line | 6 | 3.2 | 0.879 |
| Linebackers | 1 | 4.0 | 0.948 |
| Defensive backs | 2 | 4.0 | 0.896 |
| Athletes and specialists | 2 | 2.5 | 0.831 |
| Whole class | 25 | 3.6 | 0.903 |
High-school signees by position group, with their average stars and 247Sports composite rating (out of 1), via CollegeFootballData.com. Athletes are signees with no set position.
Drafted in 2024
The 2024 draft| Rd 1 | Caleb Williams QB | Chicago Bears |
| Rd 3 | Calen Bullock S | Houston Texans |
| Rd 3 | MarShawn Lloyd RB | Green Bay Packers |
| Rd 6 | Jarrett Kingston OG | San Francisco 49ers |
| Rd 7 | Brenden Rice WR | Los Angeles Chargers |
| Rd 7 | Solomon Byrd DE | Houston Texans |
| Rd 7 | Tahj Washington WR | Miami Dolphins |
Roster 110
The 2023 roster110 players, with numbers, heights, hometowns and each player’s 2023 line; 67 have a stat line. See the roster
Transfers in 15
The 2023 portal Bear Alexander DL | ★★★★ | from  Georgia |
 Anthony Lucas DL | ★★★★ | from  Texas A&M |
| Christian Roland-Wallace CB | ★★★★ | from  Arizona |
| Dorian Singer WR | ★★★★ | from Arizona |
 Emmanuel Pregnon OL | ★★★★ | from  Wyoming |
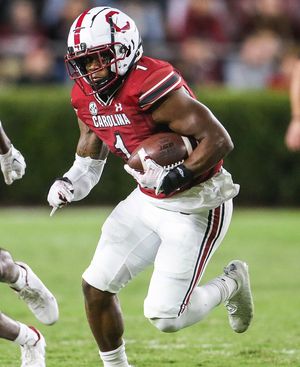 MarShawn Lloyd RB | ★★★★ | from  South Carolina |
 Mason Cobb LB | ★★★★ | from  Oklahoma State |
 Jack Sullivan DL | ★★★★ | from  Purdue |
 Tre’Quon Fegans CB | ★★★★ | from  Alabama |
 Jamil Muhammad LB | ★★★ | from  Georgia State |
 Jarrett Kingston OL | ★★★ | from  Washington State |
| Kyon Barrs DL | ★★★ | from Arizona |
And 3 more, lower-rated or unrated.
Transfers out 20
 C.J. Williams WR | ★★★★ | to  Wisconsin |
| Gary Bryant Jr. WR | ★★★★ | to  Oregon |
| Kyle Ford WR | ★★★★ | to  UCLA |
| Xavion Alford S | ★★★ | to  Arizona State |
| Ralen Goforth LB | ★★★ | to  Washington |
| Courtland Ford OT | ★★★ | to  Kentucky |
| Malcolm Epps TE | ★★★ | to  Pittsburgh |
| Jake Smith WR | ★★★ | to Arizona State |
| Briton Allen S | ★★★ | to  Utah |
| Jayden Williams CB | ★★★ | no new school on file |
| Julien Simon LB | ★★★★ | to  Tulsa |
| Latrell McCutchin CB | ★★★★ | to  Houston |
And 8 more, lower-rated or unrated.
2023 Pac-12 standings
| Team | Conf. | Overall | AP final |
|---|---|---|---|
| Washington | 9–0 | 14–1 | 2 |
| Oregon | 8–1 | 12–2 | 6 |
| Arizona | 7–2 | 10–3 | 11 |
| Utah | 5–4 | 8–5 | |
| USC | 5–4 | 8–5 | |
 Oregon State | 5–4 | 8–5 | |
| UCLA | 4–5 | 8–5 | |
| California | 4–5 | 6–7 | |
| Washington State | 2–7 | 5–7 | |
| Arizona State | 2–7 | 3–9 | |
| Stanford | 2–7 | 3–9 | |
| Colorado | 1–8 | 4–8 |
Ordered by conference winning percentage, then conference wins. Division splits and tiebreakers aren’t applied.