
2003 NC State
8–5 (4–4 Atlantic Coast Conference), coached by Chuck Amato. Share
Schedule and results
- Biggest winBeat Western Carolina 59–20Aug 30
By 39 points, its widest win.
| Date | Opponent | Result | Elo |
|---|---|---|---|
| Aug 30 | vs Western Carolina | W 59–20 | 91% |
| Sep 6 | at Wake Forest | L 24–38 | 54% |
| Sep 13 | at 3Ohio State | L 38–44 | 27% |
| Sep 20 | vs Texas Tech | W 49–21 | 53% |
| Sep 27 | vs North Carolina | W 47–34 | 83% |
| Oct 4 | at Georgia Tech | L 21–29 | 58% |
| Oct 11 | vs UConn | W 31–24 | 71% |
| Oct 16 | vs Clemson | W 17–15 | 64% |
| Oct 25 | at Duke | W 28–21 | 81% |
| Nov 1 | vs Virginia | W 51–37 | 61% |
| Nov 15 | at 13Florida State | L 44–50 | 36% |
| Nov 22 | vs Maryland | L 24–26 | 55% |
| Dec 22Bowls & playoff | vs KansasTangerine Bowl | W 56–26 | 75% |
Elo: a pregame chance from scores alone.
How it ended: Beat Kansas 56–26 in the Tangerine Bowl; unranked in the final AP poll; tied for 4th in the Atlantic Coast Conference.
In program history: The 10th-best season in program history by end-of-season Elo (of 125 on file).
AP poll, week by week
- Wk 1: 16
- Wk 3: 14
- Wk 4: 24
Players on this team
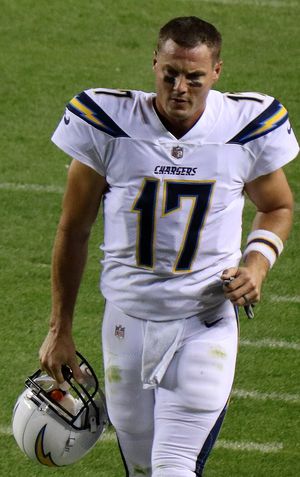 Philip RiversQuarterback
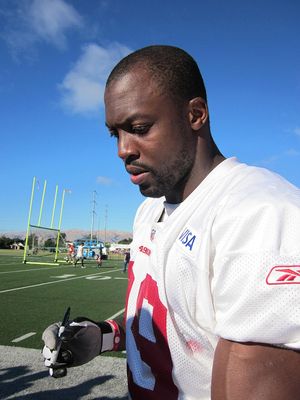 Manny LawsonDefensive end
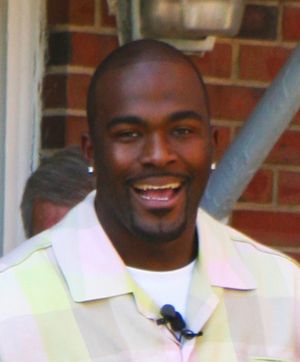 Mario WilliamsDefensive end
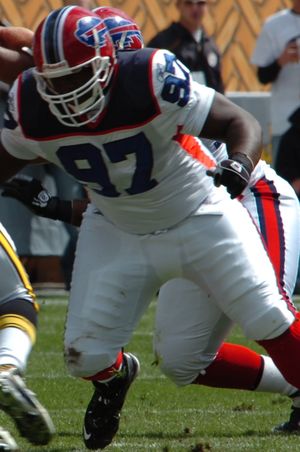 John McCargoDefensive tackle
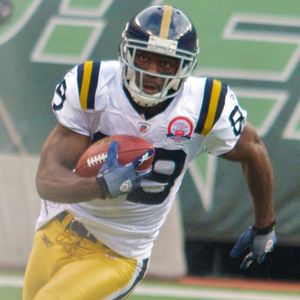 Jerricho CotcheryReceiver
- A.J. DavisDefensive back
- T.J. WilliamsTight end
- Marcus StoneQuarterback
- Tramain HallReceiver
- Richard WashingtonReceiver
- Garland Heath
Before 2004 our records hold honors and the draft; these are the players whose college years here, from their Wikipedia articles or their honors, include 2003.
Led the nationPhilip Rivers: passer rating (170.5)
- Record
- 8–5
- Conference
- 4–4 tied for 4th in Atlantic Coast Conference
- AP final
- Unranked peak No. 14
- Points
- 489–385
- Coach
- Chuck Amato
- Elo
- 1633 +16 this season
- SP+ rating
- 17.3 No. 18 of 117; offense No. 6, defense No. 68
- SRS
- 10.7 No. 22 of 117 in Division I-A
- Recruiting class
- No. 17
- Offensive coordinator
- Noel Mazzone
- Defensive coordinator
- Chuck Amato
Drives and havoc
| Points per trip inside the 40 | Average start | Havoc | |
|---|---|---|---|
| Offense | -0.1 | own 29 | — allowed |
| Defense | 0.0 | own 30 | — caused |
A trip inside the 40 is a drive that reaches the opponent’s 40-yard line; points per trip is how many it scored on average (allowed, on defense). Average start is where drives began (the defense’s line is where its opponents started). Havoc is the share of plays ending in a tackle for loss, a forced fumble, an interception or a pass broken up. From CollegeFootballData.com.
Top recruits in the 2003 class
| Marcus Stone DUAL | ★★★★ | No. 113 |
| Yomi Ojo OT | ★★★ | No. 682 |
| Maurice Charles SDE | ★★ | No. 1050 |
| Guerlin Dervil OLB | ★★ | No. 1050 |
| Phillip Holloman CB | ★★ | No. 1050 |
247Sports composite rankings via CollegeFootballData.com; national rank in the class.
The 2003 class by position
| Signed | Stars | Rating | |
|---|---|---|---|
| Quarterbacks | 1 | 4.0 | 0.933 |
| Offensive line | 1 | 3.0 | 0.800 |
| Defensive line | 1 | 2.0 | 0.767 |
| Linebackers | 1 | 2.0 | 0.767 |
| Defensive backs | 1 | 2.0 | 0.767 |
| Whole class | 5 | 2.6 | 0.807 |
High-school signees by position group, with their average stars and 247Sports composite rating (out of 1), via CollegeFootballData.com. Athletes are signees with no set position.
Drafted in 2004
The 2004 draft| Rd 1 | Philip Rivers QB | New York Giants |
| Rd 3 | Sean Locklear OG | Seattle Seahawks |
| Rd 4 | Jerricho Cotchery WR | New York Jets |
All-ACC
4 first team, 1 second teamFirst team
- Jerricho CotcheryWRAP-1
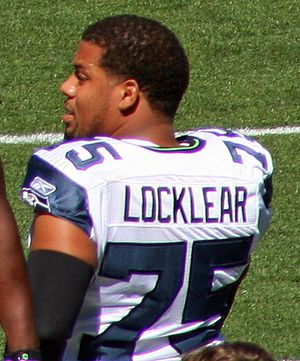 Sean LocklearOTAP-1
- Philip RiversQBAP-1
 Andre MaddoxDBAP-1
Second team
- Pat ThomasLBAP-2
From Wikipedia’s 2003 all-conference team article, with the selectors that named each player (AP-1: the Associated Press’s first team).
2003 Atlantic Coast Conference standings
Conference page| Team | Conf. | Overall | AP final |
|---|---|---|---|
| Florida State | 7–1 | 10–3 | 11 |
| Maryland | 6–2 | 10–3 | 17 |
| Clemson | 5–3 | 9–4 | 22 |
| NC State | 4–4 | 8–5 | |
| Virginia | 4–4 | 8–5 | |
| Georgia Tech | 4–4 | 7–6 | |
| Wake Forest | 3–5 | 5–7 | |
| Duke | 2–6 | 4–8 | |
| North Carolina | 1–7 | 2–10 |
Ordered by conference winning percentage, then conference wins. Division splits and tiebreakers aren’t applied.