
2003 Maryland
10–3 (6–2 Atlantic Coast Conference), coached by Ralph Friedgen, finished No. 17 in the AP poll. Share
Schedule and results
- Biggest upsetBeat No. 21 West Virginia 41–7Jan 1
West Virginia was ranked No. 21, above it.
| Date | Opponent | Result | Elo |
|---|---|---|---|
| Aug 28 | at Northern Illinois | L 13–20 | 55% |
| Sep 6 | at 11Florida State | L 10–35 | 37% |
| Sep 13 | vs The Citadel | W 61–0 | 88% |
| Sep 20 | vs West Virginia | W 34–7 | 64% |
| Sep 27 | at Eastern Michigan | W 37–13 | 85% |
| Oct 4 | vs Clemson | W 21–7 | 65% |
| Oct 11 | vs Duke | W 33–20 | 89% |
| Oct 23 | at Georgia Tech | L 3–7 | 53% |
| Nov 1 | vs North Carolina | W 59–21 | 85% |
| Nov 13 | vs Virginia | W 27–17 | 66% |
| Nov 22 | at NC State | W 26–24 | 45% |
| Nov 29 | at Wake Forest | W 41–28 | 68% |
| Jan 1Bowls & playoff | vs21West VirginiaGator Bowl | W 41–7 | 52% |
Elo: a pregame chance from scores alone.
How it ended: Beat West Virginia 41–7 in the Gator Bowl; No. 17 in the final AP poll; 2nd in the Atlantic Coast Conference.
In program history: The 7th-best season in program history by end-of-season Elo (of 120 on file).
AP poll, week by week
- Wk 1: 15
- Wk 16: 24
- Final: 17
Players on this team
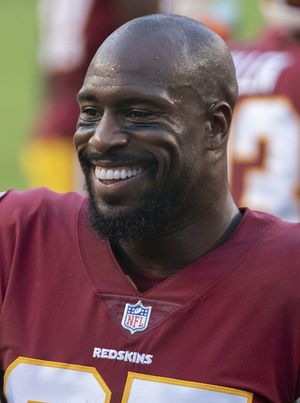 Vernon DavisTight end
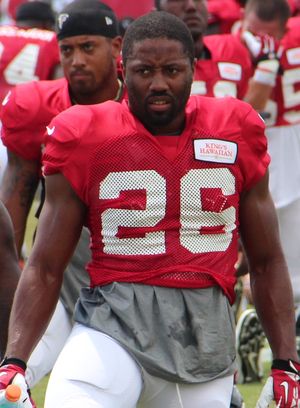 Josh WilsonDefensive back
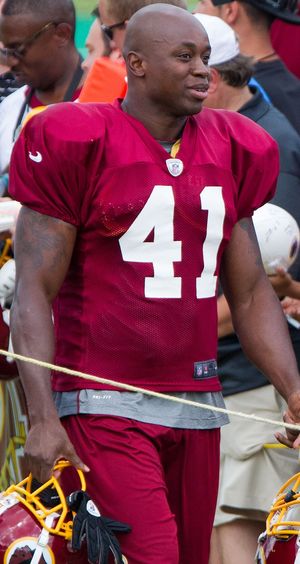 Madieu WilliamsDefensive back
 Randy StarksDefensive tackle
- D’Qwell JacksonLinebacker
- Dre MooreDefensive tackle
- Adam PodleshPunter
- Sam HollenbachQuarterback
- Dan GronkowskiTight end
- Chris Kelley
- Lance BallRunning back
Before 2004 our records hold honors and the draft; these are the players whose college years here, from their Wikipedia articles or their honors, include 2003.
- Record
- 10–3
- Conference
- 6–2 2nd in Atlantic Coast Conference
- AP final
- No. 17 peak No. 15
- Points
- 406–206
- Coach
- Ralph Friedgen
- Elo
- 1715 +88 this season
- SP+ rating
- 20.8 No. 14 of 117; offense No. 29, defense No. 9
- SRS
- 15.3 No. 9 of 117 in Division I-A
- Recruiting class
- No. 25
- Offensive coordinator
- Charlie Taaffe
- Defensive coordinator
- Gary Blackney
Drives and havoc
| Points per trip inside the 40 | Average start | Havoc | |
|---|---|---|---|
| Offense | -0.1 | own 33 | — allowed |
| Defense | 0.0 | own 27 | — caused |
A trip inside the 40 is a drive that reaches the opponent’s 40-yard line; points per trip is how many it scored on average (allowed, on defense). Average start is where drives began (the defense’s line is where its opponents started). Havoc is the share of plays ending in a tackle for loss, a forced fumble, an interception or a pass broken up. From CollegeFootballData.com.
Top recruits in the 2003 class
| Wesley Jefferson ILB | ★★★★★ | No. 6 |
| Brandon Nixon OT | ★★★ | No. 682 |
| Brock Choate OT | ★★★ | No. 682 |
| Garrick Clig OG | ★★★ | No. 682 |
| Jermaine Lemons WDE | ★★★ | No. 682 |
247Sports composite rankings via CollegeFootballData.com; national rank in the class.
The 2003 class by position
| Signed | Stars | Rating | |
|---|---|---|---|
| Quarterbacks | 1 | 2.0 | 0.767 |
| Offensive line | 3 | 3.0 | 0.800 |
| Defensive line | 4 | 2.5 | 0.783 |
| Linebackers | 1 | 5.0 | 0.996 |
| Defensive backs | 1 | 3.0 | 0.800 |
| Whole class | 10 | 2.9 | 0.810 |
High-school signees by position group, with their average stars and 247Sports composite rating (out of 1), via CollegeFootballData.com. Athletes are signees with no set position.
Drafted in 2004
The 2004 draft| Rd 2 | Madieu Williams DB | Cincinnati Bengals |
| Rd 3 | Randy Starks DT | Tennessee Titans |
| Rd 4 | Leon Joe LB | Chicago Bears |
| Rd 7 | Jeff Dugan TE | Minnesota Vikings |
| Rd 7 | Bruce Perry RB | Philadelphia Eagles |
All-ACC
4 first team, 6 second teamFirst team
 C.J. BrooksOGAP-1
- Randy StarksDLAP-1
- Nick NovakKAP-1
- Steve SuterRSAP-1
Second team
- Jeff DuganTEAP-2
- Kevin EliDLAP-2
- D’Qwell JacksonLBAP-2
- Domonique FoxworthDBAP-2
- Madieu WilliamsDBAP-2
- Adam PodleshPAP-2
From Wikipedia’s 2003 all-conference team article, with the selectors that named each player (AP-1: the Associated Press’s first team).
2003 Atlantic Coast Conference standings
| Team | Conf. | Overall | AP final |
|---|---|---|---|
| Florida State | 7–1 | 10–3 | 11 |
| Maryland | 6–2 | 10–3 | 17 |
| Clemson | 5–3 | 9–4 | 22 |
| NC State | 4–4 | 8–5 | |
| Virginia | 4–4 | 8–5 | |
| Georgia Tech | 4–4 | 7–6 | |
| Wake Forest | 3–5 | 5–7 | |
| Duke | 2–6 | 4–8 | |
| North Carolina | 1–7 | 2–10 |
Ordered by conference winning percentage, then conference wins. Division splits and tiebreakers aren’t applied.