
2023 Missouri
11–2 (6–2 Southeastern Conference), coached by Eli Drinkwitz, finished No. 8 in the AP poll. Share
Schedule and results
- Biggest upsetBeat No. 7 Ohio State 14–3Dec 29
Ohio State was ranked No. 7 and favored to win.
- Most excitingLost to No. 23 LSU 39–49Oct 7
The win probability swung the most, by CollegeFootballData.com’s excitement index.
| Date | Opponent | Result | Elo |
|---|---|---|---|
| Aug 31 | vs South Dakota | W 35–10 | 83% |
| Sep 9 | vs Middle Tennessee | W 23–19 | 59% |
| Sep 16 | vs 15Kansas State | W 30–27 | 38% |
| Sep 23 | vs Memphis | W 34–27 | 45% |
| Sep 30 | at Vanderbilt | W 38–21 | 62% |
| Oct 7 | vs 23LSU | L 39–49 | 53% |
| Oct 14 | at 24Kentucky | W 38–21 | 34% |
| Oct 21 | vs South Carolina | W 34–12 | 67% |
| Nov 4 | at 1Georgia | L 21–30 | 17% |
| Nov 11 | vs 14Tennessee | W 36–7 | 47% |
| Nov 18 | vs Florida | W 33–31 | 74% |
| Nov 24 | at Arkansas | W 48–14 | 64% |
| Dec 29Bowls & playoff | vs 7Ohio StateCotton Bowl | W 14–3 | 31% |
Elo: a pregame chance from scores alone.
How it ended: Beat Ohio State 14–3 in the Cotton Bowl; No. 8 in the final AP poll; tied for 3rd in the Southeastern Conference.
In program history: The 4th-best season in program history by end-of-season Elo (of 129 on file).
AP poll, week by week
- Wk 5: 23
- Wk 6: 21
- Wk 8: 20
- Wk 9: 16
- Wk 10: 14
- Wk 11: 16
- Wk 12: 11
- Wk 13: 10
- Wk 14: 9
- Wk 15: 9
- Final: 8
- Record
- 11–2
- Conference
- 6–2 tied for 3rd in Southeastern Conference
- AP final
- No. 8 peak No. 8
- Points
- 423–271
- Coach
- Eli Drinkwitz
- Elo
- 1709 +215 this season
- SP+ rating
- 19.3 No. 10 of 133; offense No. 13, defense No. 14, special teams No. 45
- SRS
- 16.8 No. 12 of 133 in FBS
- Returning
- 65% of last season’s EPA, No. 35 of 131
- Recruiting class
- No. 34 roster talent No. 24 in FBS
- Offensive coordinator
- Kirby Moore
- Defensive coordinators
- Blake Baker and D.J. Smith
- Offense
- Pistol
- Defense
- 4–3
How good, play by play
| EPA per play | Success | Explosiveness | FBS rank | |
|---|---|---|---|---|
| Offense | 0.24 | 45% | 1.31 | 15th of 133 |
| Defense | 0.08 | 38% | 1.29 | 51st of 133 |
| Opponent-adjusted | 0.23 off 0.03 def | 46% off 35% def | — | 14th off 25th def |
How these are measured
Play-weighted averages over games against FBS opponents; raw numbers, not adjusted for the strength of the opponent. EPA (expected points added) measures how much each play changed the expected score; success rate counts plays that kept the offense on schedule; explosiveness is the average EPA on successful plays. Lower is better on defense. Ranked by EPA per play among teams that were FBS that season. The opponent-adjusted row (offense / defense) is CollegeFootballData.com’s WEPA, which accounts for who each team played.
Drives and havoc
| Points per trip inside the 40 | Average start | Havoc | |
|---|---|---|---|
| Offense | 4.5 | own 29 | 14% allowed |
| Defense | 3.9 | own 26 | 20% caused |
CORE rating 17.0, 15th of 133 (offense 10.4, defense -6.6).
A trip inside the 40 is a drive that reaches the opponent’s 40-yard line; points per trip is how many it scored on average (allowed, on defense). Average start is where drives began (the defense’s line is where its opponents started). Havoc is the share of plays ending in a tackle for loss, a forced fumble, an interception or a pass broken up. CORE is CollegeFootballData.com’s context- and opponent-adjusted rating (points better than an average team; lower is better on defense). From CollegeFootballData.com.
Leaders
| Passing yards | Brady Cook QB | 3,302 yds |
| Passing touchdowns | Brady Cook QB | 21 TD |
| Rushing yards | Cody Schrader RB | 1,617 yds |
| Rushing touchdowns | Cody Schrader RB | 14 TD |
| Receiving yards | Luther Burden III WR | 1,205 yds |
| Receiving touchdowns | Luther Burden III WR | 9 TD |
| Tackles | Jaylon Carlies DB | 64 tkl |
| Sacks | Darius Robinson DL | 8.5 sacks |
| Interceptions | Kris Abrams-Draine DB | 4 INT |
Top recruits in the 2023 class
| Brett Norfleet TE | ★★★★ | No. 236 |
| Joshua Manning WR | ★★★★ | No. 267 |
| Marvin Burks Jr. S | ★★★★ | No. 323 |
| Gabarri Johnson QB | ★★★★ | No. 354 |
| Logan Reichert OT | ★★★★ | No. 445 |
247Sports composite rankings via CollegeFootballData.com; national rank in the class.
The 2023 class by position
| Signed | Stars | Rating | |
|---|---|---|---|
| Quarterbacks | 1 | 4.0 | 0.898 |
| Running backs | 1 | 3.0 | 0.879 |
| Receivers | 5 | 3.4 | 0.892 |
| Offensive line | 2 | 3.5 | 0.881 |
| Defensive line | 3 | 3.0 | 0.865 |
| Linebackers | 2 | 3.0 | 0.828 |
| Defensive backs | 3 | 3.3 | 0.875 |
| Athletes and specialists | 2 | 3.0 | 0.851 |
| Whole class | 19 | 3.3 | 0.872 |
High-school signees by position group, with their average stars and 247Sports composite rating (out of 1), via CollegeFootballData.com. Athletes are signees with no set position.
Drafted in 2024
The 2024 draft| Rd 1 | Darius Robinson DE | Arizona Cardinals |
| Rd 2 | Ennis Rakestraw Jr. CB | Detroit Lions |
| Rd 3 | Ty’Ron Hopper LB | Green Bay Packers |
| Rd 4 | Javon Foster OT | Jacksonville Jaguars |
| Rd 5 | Kris Abrams-Draine CB | Denver Broncos |
| Rd 5 | Jaylon Carlies S | Indianapolis Colts |
Roster 110
The 2023 roster110 players, with numbers, heights, hometowns and each player’s 2023 line; 50 have a stat line. See the roster
Transfers in 8
The 2023 portal Cam’Ron Johnson OT | ★★★★ | from  Houston |
 Jake Garcia QB | ★★★★ | from  Miami |
 Marcellus Johnson OT | ★★★★ | from  Eastern Michigan |
 Theo Wease WR | ★★★★ | from  Oklahoma |
 Austin Firestone DL | ★★★ | from  Northwestern |
 Sidney Williams LB | ★★★ | from  Florida State |
| Tre’Vez Johnson S | ★★★ | from  Florida |
 Nyles Gaddy DE | ★★★ | from  Jackson State |
Transfers out 20
 Dominic Lovett WR | ★★★★ | to  Georgia |
| Hyrin White OT | ★★★ | to  SMU |
| Marcus Scott II CB | ★★★ | to  California |
| Trajan Jeffcoat DE | ★★★ | to  Arkansas |
| Arden Walker DL | ★★★ | to  Colorado |
| Zach Lovett LB | ★★★ | to  Iowa State |
| Jalani Williams S | ★★★★ | no new school on file |
| Travion Ford DE | ★★★★ | to  Toledo |
| Tyler Macon QB | ★★★★ | to  Alcorn State |
| Daniel Robledo DE | ★★★ | no new school on file |
| D.J. Jackson CB | ★★★ | to  Texas State |
| Devin Nicholson LB | ★★★ | to  Kent State |
And 8 more, lower-rated or unrated.
All-SEC
5 first team, 3 second teamFirst team
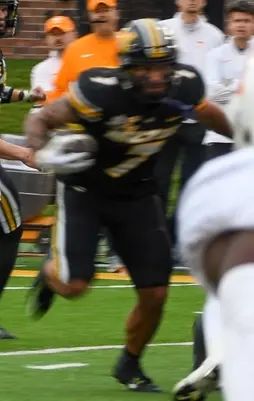 Cody SchraderRBAP-1; Coaches-1
 Luther Burden IIIWRAP-1; Coaches-1
- Javon FosterOLAP-1; Coaches-1
- Darius RobinsonDEAP-1; Coaches-1
- Kris Abrams-DraineDBAP-1; Coaches-1
Second team
- Cam’Ron JohnsonOLAP-2
- Ty’Ron HopperLBCoaches-2
- Harrison MevisKAP-2; Coaches-2
From Wikipedia’s 2023 all-conference team article, with the selectors that named each player (AP-1: the Associated Press’s first team).
2023 Southeastern Conference standings
Conference page| Team | Conf. | Overall | AP final |
|---|---|---|---|
| Georgia | 8–0 | 13–1 | 4 |
 Alabama | 8–0 | 12–2 | 5 |
| Missouri | 6–2 | 11–2 | 8 |
 Ole Miss | 6–2 | 11–2 | |
| LSU | 6–2 | 10–3 | 12 |
| Tennessee | 4–4 | 9–4 | 17 |
 Texas A&M | 4–4 | 7–6 | |
| Kentucky | 3–5 | 7–6 | |
 Auburn | 3–5 | 6–7 | |
| South Carolina | 3–5 | 5–7 | |
| Florida | 3–5 | 5–7 | |
 Mississippi State | 1–7 | 5–7 | 9 |
| Arkansas | 1–7 | 4–8 | |
| Vanderbilt | 0–8 | 2–10 |
Ordered by conference winning percentage, then conference wins. Division splits and tiebreakers aren’t applied.