2023 Kentucky
7–6 (3–5 Southeastern Conference), coached by Mark Stoops. Share
Schedule and results
- Biggest upsetBeat No. 9 Louisville 38–31Nov 25
Louisville was ranked No. 9 and favored to win.
- Most excitingLost to Clemson 35–38Dec 29
The win probability swung the most, by CollegeFootballData.com’s excitement index.
| Date | Opponent | Result | Elo |
|---|---|---|---|
| Sep 2 | vs Ball State | W 44–14 | 70% |
| Sep 9 | vs Eastern Kentucky | W 28–17 | 84% |
| Sep 16 | vs Akron | W 35–3 | 82% |
| Sep 23 | at Vanderbilt | W 45–28 | 63% |
| Sep 30 | vs 22Florida | W 33–14 | 65% |
| Oct 7 | at 1Georgia | L 13–51 | 21% |
| Oct 14 | vs Missouri | L 21–38 | 66% |
| Oct 28 | vs 21Tennessee | L 27–33 | 45% |
| Nov 4 | at Mississippi State | W 24–3 | 46% |
| Nov 11 | vs 8Alabama | L 21–49 | 30% |
| Nov 18 | at South Carolina | L 14–17 | 49% |
| Nov 25 | at 9Louisville | W 38–31 | 26% |
| Dec 29Bowls & playoff | vs ClemsonGator Bowl | L 35–38 | 38% |
Elo: a pregame chance from scores alone.
How it ended: Lost to Clemson 38–35 in the Gator Bowl; unranked in the final AP poll; tied for 8th in the Southeastern Conference.
In program history: The tied 17th-best season in program history by end-of-season Elo (of 123 on file).
AP poll, week by week
- Wk 6: 20
- Wk 7: 24
Led the nationBarion Brown: kickoff return average (36.0)
- Record
- 7–6
- Conference
- 3–5 tied for 8th in Southeastern Conference
- AP final
- Unranked peak No. 20
- Points
- 378–336
- Coach
- Mark Stoops
- Elo
- 1580 +31 this season
- SP+ rating
- 10.5 No. 22 of 133; offense No. 33, defense No. 34, special teams No. 36
- SRS
- 6.1 No. 40 of 133 in FBS
- Returning
- 48% of last season’s EPA, No. 71 of 131
- Recruiting class
- No. 32 roster talent No. 31 in FBS
- Offensive coordinator
- Liam Coen
- Defensive coordinator
- Brad White
- Offense
- Multiple pro-style
- Defense
- 3–4 or 4–3
How good, play by play
| EPA per play | Success | Explosiveness | FBS rank | |
|---|---|---|---|---|
| Offense | 0.11 | 39% | 1.46 | 61st of 133 |
| Defense | 0.10 | 44% | 1.15 | 63rd of 133 |
| Opponent-adjusted | 0.14 off 0.09 def | 42% off 42% def | — | 48th off 58th def |
How these are measured
Play-weighted averages over games against FBS opponents; raw numbers, not adjusted for the strength of the opponent. EPA (expected points added) measures how much each play changed the expected score; success rate counts plays that kept the offense on schedule; explosiveness is the average EPA on successful plays. Lower is better on defense. Ranked by EPA per play among teams that were FBS that season. The opponent-adjusted row (offense / defense) is CollegeFootballData.com’s WEPA, which accounts for who each team played.
Drives and havoc
| Points per trip inside the 40 | Average start | Havoc | |
|---|---|---|---|
| Offense | 4.5 | own 29 | 20% allowed |
| Defense | 4.0 | own 31 | 16% caused |
CORE rating 3.6, 43rd of 133 (offense 1.1, defense -2.5).
A trip inside the 40 is a drive that reaches the opponent’s 40-yard line; points per trip is how many it scored on average (allowed, on defense). Average start is where drives began (the defense’s line is where its opponents started). Havoc is the share of plays ending in a tackle for loss, a forced fumble, an interception or a pass broken up. CORE is CollegeFootballData.com’s context- and opponent-adjusted rating (points better than an average team; lower is better on defense). From CollegeFootballData.com.
Leaders
| Passing yards | Devin Leary QB | 2,746 yds |
| Passing touchdowns | Devin Leary QB | 25 TD |
| Rushing yards | Re’Mahn Davis RB | 1,129 yds |
| Rushing touchdowns | Re’Mahn Davis RB | 14 TD |
| Receiving yards | Dane Key WR | 636 yds |
| Receiving touchdowns | Re’Mahn Davis RB | 7 TD |
| Tackles | D’Eryk Jackson LB | 89 tkl |
| Sacks | Deone Walker DT | 7.5 sacks |
| Interceptions | Maxwell Hairston DB | 5 INT |
Top recruits in the 2023 class
| Shamar Porter WR | ★★★★ | No. 306 |
| Avery Stuart S | ★★★★ | No. 319 |
| Grant Godfrey LB | ★★★★ | No. 331 |
| Kendrick Gilbert DL | ★★★★ | No. 385 |
| Jaremiah Anglin Jr. S | ★★★★ | No. 413 |
| Jayvant Brown LB | ★★★★ | No. 418 |
| Khamari Anderson TE | ★★★★ | No. 442 |
247Sports composite rankings via CollegeFootballData.com; national rank in the class.
The 2023 class by position
| Signed | Stars | Rating | |
|---|---|---|---|
| Running backs | 1 | 3.0 | 0.882 |
| Receivers | 5 | 3.4 | 0.883 |
| Offensive line | 3 | 3.0 | 0.867 |
| Defensive line | 3 | 3.3 | 0.882 |
| Linebackers | 2 | 4.0 | 0.896 |
| Defensive backs | 3 | 3.7 | 0.884 |
| Athletes and specialists | 1 | 3.0 | 0.857 |
| Whole class | 18 | 3.4 | 0.880 |
High-school signees by position group, with their average stars and 247Sports composite rating (out of 1), via CollegeFootballData.com. Athletes are signees with no set position.
Drafted in 2024
The 2024 draft| Rd 3 | Andru Phillips CB | New York Giants |
| Rd 3 | Trevin Wallace LB | Carolina Panthers |
| Rd 4 | Ray Davis RB | Buffalo Bills |
| Rd 6 | Devin Leary QB | Baltimore Ravens |
Roster 118
The 2023 roster118 players, with numbers, heights, hometowns and each player’s 2023 line; 57 have a stat line. See the roster
Transfers in 12
The 2023 portal Devin Leary QB | ★★★★ | from  NC State |
 J.Q. Hardaway CB | ★★★★ | from  Cincinnati |
| Demie Sumo RB | ★★★★ | from NC State |
 Keeshawn Silver DL | ★★★★ | from  North Carolina |
| Ray Davis RB | ★★★★ | from  Vanderbilt |
| Tanner Bowles OL | ★★★★ | from  Alabama |
 Ben Christman OT | ★★★ | from  Ohio State |
| Jantzen Dunn S | ★★★ | from Ohio State |
 Marques Cox OT | ★★★ | from  Northern Illinois |
 Courtland Ford OT | ★★★ | from  USC |
| Daveren Rayner LB | ★★★ | from Northern Illinois |
 Alex Raynor K | ★★★ | from  Georgia Southern |
Transfers out 21
 Justin Rogers DL | ★★★★ | to  Auburn |
| Kiyaunta Goodwin OT | ★★★★ | to  Florida |
| Deondre Buford OT | ★★★ | to Cincinnati |
| Vito Tisdale S | ★★★ | to  Colorado |
 David Wohlabaugh Jr. OL | ★★★ | to  Syracuse |
| Ja’Kobi Albert ATH | ★★★ | to  Mississippi State |
| Kavosiey Smoke RB | ★★★ | to Colorado |
| Chauncey Magwood WR | ★★★ | to  UCF |
| Chris Lewis WR | ★★★★ | to  Troy |
| John Young OT | ★★★★ | to  Miami (OH) |
| Jordan Anthony WR | ★★★★ | to  Texas A&M |
| Michael Drennen RB | ★★★★ | no new school on file |
And 9 more, lower-rated or unrated.
All-SEC
1 first team, 4 second teamFirst team
- Ray DavisRBAP-1; Coaches-2
Second team
- Eli CoxCCoaches-2
- Deone WalkerDTAP-2
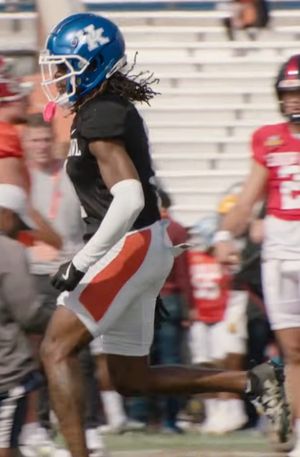 Maxwell HairstonDBAP-2
- Barion BrownAPBAP-2; Coaches-2
From Wikipedia’s 2023 all-conference team article, with the selectors that named each player (AP-1: the Associated Press’s first team).
2023 Southeastern Conference standings
Conference page| Team | Conf. | Overall | AP final |
|---|---|---|---|
| Georgia | 8–0 | 13–1 | 4 |
| Alabama | 8–0 | 12–2 | 5 |
| Missouri | 6–2 | 11–2 | 8 |
 Ole Miss | 6–2 | 11–2 | |
 LSU | 6–2 | 10–3 | 12 |
| Tennessee | 4–4 | 9–4 | 17 |
 Texas A&M | 4–4 | 7–6 | |
| Kentucky | 3–5 | 7–6 | |
 Auburn | 3–5 | 6–7 | |
| South Carolina | 3–5 | 5–7 | |
| Florida | 3–5 | 5–7 | |
| Mississippi State | 1–7 | 5–7 | 9 |
 Arkansas | 1–7 | 4–8 | |
| Vanderbilt | 0–8 | 2–10 |
Ordered by conference winning percentage, then conference wins. Division splits and tiebreakers aren’t applied.