
2023 LSU
10–3 (6–2 Southeastern Conference), coached by Brian Kelly, finished No. 12 in the AP poll. Share
Schedule and results
- Best winBeat No. 21 Missouri 49–39Oct 7
Over the best-ranked team it beat, on the road.
- Most excitingLost to No. 20 Ole Miss 49–55Sep 30
The win probability swung the most, by CollegeFootballData.com’s excitement index.
| Date | Opponent | Result | Elo |
|---|---|---|---|
| Sep 3 | vs 8Florida State | L 24–45 | 50% |
| Sep 9 | vs Grambling | W 72–10 | 92% |
| Sep 16 | at Mississippi State | W 41–14 | 38% |
| Sep 23 | vs Arkansas | W 34–31 | 64% |
| Sep 30 | at 20Ole Miss | L 49–55 | 46% |
| Oct 7 | at 21Missouri | W 49–39 | 47% |
| Oct 14 | vs Auburn | W 48–18 | 73% |
| Oct 21 | vs Army | W 62–0 | 80% |
| Nov 4 | at 8Alabama | L 28–42 | 29% |
| Nov 11 | vs Florida | W 52–35 | 74% |
| Nov 18 | vs Georgia State | W 56–14 | 79% |
| Nov 25 | vs Texas A&M | W 42–30 | 68% |
| Jan 1Bowls & playoff | vs WisconsinReliaQuest Bowl | W 35–31 | 69% |
Elo: a pregame chance from scores alone.
How it ended: Beat Wisconsin 35–31 in the ReliaQuest Bowl; No. 12 in the final AP poll; tied for 3rd in the Southeastern Conference.
In program history: The 23rd-best season in program history by end-of-season Elo (of 123 on file).
AP poll, week by week
- Wk 1: 5
- Wk 2: 14
- Wk 3: 14
- Wk 4: 12
- Wk 5: 13
- Wk 6: 23
- Wk 7: 22
- Wk 8: 19
- Wk 9: 15
- Wk 10: 13
- Wk 11: 18
- Wk 12: 15
- Wk 13: 14
- Wk 14: 13
- Wk 15: 13
- Final: 12
Led the nationJayden Daniels: passer rating (208.0), yards per carry (8.4), total offense (4,946 yds), total offense per game (412.2); Brian Thomas Jr.: receiving touchdowns (17 TD)
Heisman TrophyJayden Daniels, QB; also the Walter Camp, Davey O’Brien, Unitas Golden Arm and Manning
2 consensus All-AmericansJayden Daniels, QB; Malik Nabers, WR
- Record
- 10–3
- Conference
- 6–2 tied for 3rd in Southeastern Conference
- AP final
- No. 12 peak No. 5
- Points
- 592–364
- Coach
- Brian Kelly
- Elo
- 1708 +106 this season
- SP+ rating
- 19.1 No. 11 of 133; offense No. 2, defense No. 52, special teams No. 82
- SRS
- 16.7 No. 13 of 133 in FBS
- Returning
- 85% of last season’s EPA, No. 11 of 131
- Recruiting class
- No. 6 roster talent No. 7 in FBS
- Offensive coordinator
- Mike Denbrock
- Defensive coordinator
- Matt House
- Captains
- Greg Brooks Jr., Will Campbell, Jayden Daniels and Mekhi Wingo
- Offense
- Multiple
- Defense
- 4–3
How good, play by play
| EPA per play | Success | Explosiveness | FBS rank | |
|---|---|---|---|---|
| Offense | 0.43 | 56% | 1.36 | 1st of 133 |
| Defense | 0.20 | 45% | 1.35 | 114th of 133 |
| Opponent-adjusted | 0.39 off 0.16 def | 56% off 44% def | — | 1st off 99th def |
How these are measured
Play-weighted averages over games against FBS opponents; raw numbers, not adjusted for the strength of the opponent. EPA (expected points added) measures how much each play changed the expected score; success rate counts plays that kept the offense on schedule; explosiveness is the average EPA on successful plays. Lower is better on defense. Ranked by EPA per play among teams that were FBS that season. The opponent-adjusted row (offense / defense) is CollegeFootballData.com’s WEPA, which accounts for who each team played.
Drives and havoc
| Points per trip inside the 40 | Average start | Havoc | |
|---|---|---|---|
| Offense | 4.9 | own 29 | 11% allowed |
| Defense | 4.4 | own 27 | 16% caused |
CORE rating 19.8, 11th of 133 (offense 27.1, defense 7.4).
A trip inside the 40 is a drive that reaches the opponent’s 40-yard line; points per trip is how many it scored on average (allowed, on defense). Average start is where drives began (the defense’s line is where its opponents started). Havoc is the share of plays ending in a tackle for loss, a forced fumble, an interception or a pass broken up. CORE is CollegeFootballData.com’s context- and opponent-adjusted rating (points better than an average team; lower is better on defense). From CollegeFootballData.com.
Leaders
| Passing yards | Jayden Daniels QB | 3,812 yds |
| Passing touchdowns | Jayden Daniels QB | 40 TD |
| Rushing yards | Jayden Daniels QB | 1,134 yds |
| Rushing touchdowns | Jayden Daniels QB | 10 TD |
| Receiving yards | Malik Nabers WR | 1,569 yds |
| Receiving touchdowns | Brian Thomas Jr. WR | 17 TD |
| Tackles | Major Burns S | 90 tkl |
| Sacks | Harold Perkins LB | 5.5 sacks |
| Interceptions | Andre Sam S | 3 INT |
Top recruits in the 2023 class
| Lance Heard OT | ★★★★★ | No. 15 |
| Da’Shawn Womack DE | ★★★★★ | No. 37 |
| Javien Toviano S | ★★★★ | No. 58 |
| Jalen Brown WR | ★★★★ | No. 69 |
| Shelton Sampson Jr. WR | ★★★★ | No. 84 |
| D.J. Chester OL | ★★★★ | No. 123 |
| Jaxon Howard DE | ★★★★ | No. 132 |
| Ka’Morreun Pimpton TE | ★★★★ | No. 149 |
247Sports composite rankings via CollegeFootballData.com; national rank in the class.
The 2023 class by position
| Signed | Stars | Rating | |
|---|---|---|---|
| Quarterbacks | 1 | 4.0 | 0.912 |
| Running backs | 2 | 4.0 | 0.922 |
| Receivers | 6 | 3.8 | 0.927 |
| Offensive line | 4 | 4.0 | 0.936 |
| Defensive line | 3 | 4.0 | 0.937 |
| Linebackers | 2 | 3.5 | 0.912 |
| Defensive backs | 7 | 3.4 | 0.903 |
| Athletes and specialists | 1 | 4.0 | 0.892 |
| Whole class | 26 | 3.8 | 0.920 |
High-school signees by position group, with their average stars and 247Sports composite rating (out of 1), via CollegeFootballData.com. Athletes are signees with no set position.
Drafted in 2024
The 2024 draft| Rd 1 | Jayden Daniels QB | Washington Commanders |
| Rd 1 | Malik Nabers WR | New York Giants |
| Rd 1 | Brian Thomas Jr. WR | Jacksonville Jaguars |
| Rd 2 | Maason Smith DT | Jacksonville Jaguars |
| Rd 4 | Jordan Jefferson DT | Jacksonville Jaguars |
| Rd 6 | Mekhi Wingo DT | Detroit Lions |
Roster 117
The 2023 roster117 players, with numbers, heights, hometowns and each player’s 2023 line; 68 have a stat line. See the roster
Transfers in 14
The 2023 portal| Denver Harris CB | ★★★★★ | from  Texas A&M |
 Zy Alexander CB | ★★★★ | from  SE Louisiana |
 J.K. Johnson CB | ★★★★ | from  Ohio State |
 Paris Shand DL | ★★★★ | from  Arizona |
| Aaron Anderson WR | ★★★★ | from  Alabama |
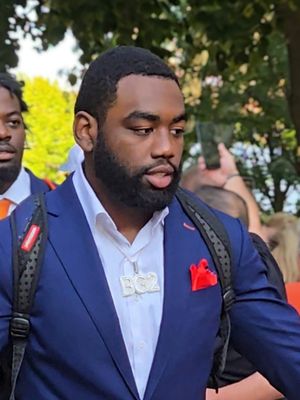 Darian Chestnut CB | ★★★★ | from  Syracuse |
 Jordan Jefferson DL | ★★★★ | from  West Virginia |
 Logan Diggs RB | ★★★★ | from  Notre Dame |
 Omar Speights LB | ★★★★ | from  Oregon State |
 Ovie Oghoufo DE | ★★★ | from  Texas |
 Andre Sam S | ★★★ | from  Tulane |
 Bradyn Swinson DE | ★★★ | from  Oregon |
And 2 more, lower-rated or unrated.
Transfers out 21
 Walker Howard QB | ★★★★ | to  Ole Miss |
| DeMario Tolan LB | ★★★★ | to  Auburn |
| Derrick Davis Jr. RB | ★★★ | to  Pittsburgh |
| Damarius McGhee CB | ★★★ | to  Kansas |
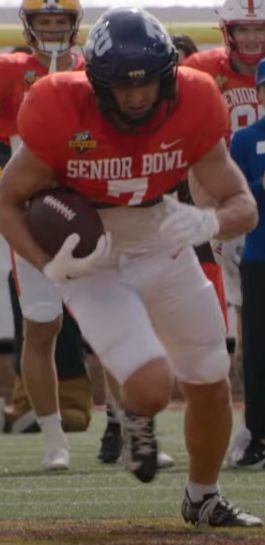 Jack Bech TE | ★★★ | to  TCU |
| Raydarious Jones CB | ★★★ | to  Mississippi State |
| Kole Taylor TE | ★★★ | to West Virginia |
| Marcus Dumervil OT | ★★★ | to  Maryland |
| Jaelyn Davis-Robinson CB | ★★★ | to  SMU |
| Antoine Sampah LB | ★★★★ | no new school on file |
| Jordan Toles S | ★★★★ | to  Morgan State |
| Kardell Thomas OL | ★★★★ | no new school on file |
And 9 more, lower-rated or unrated.
All-SEC
3 first team, 3 second teamFirst team
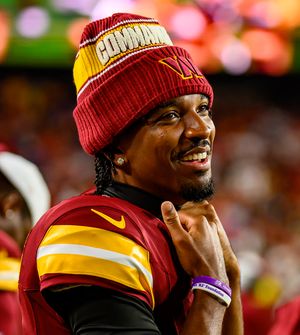 Jayden DanielsQBAP-1; Coaches-1
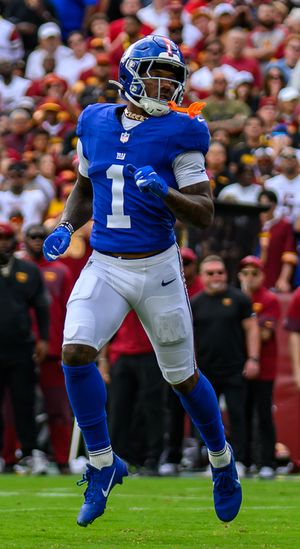 Malik NabersWRAP-1; Coaches-1
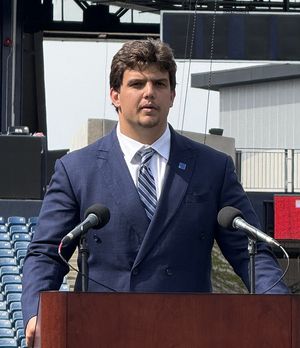 Will CampbellOLAP-2; Coaches-1
Second team
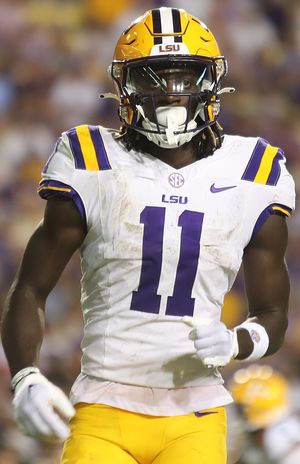 Brian Thomas Jr.WRAP-2; Coaches-2
- Emery JonesOLCoaches-2
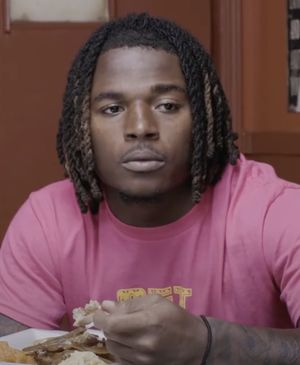 Harold PerkinsLBCoaches-2
From Wikipedia’s 2023 all-conference team article, with the selectors that named each player (AP-1: the Associated Press’s first team).
2023 Southeastern Conference standings
Conference page| Team | Conf. | Overall | AP final |
|---|---|---|---|
 Georgia | 8–0 | 13–1 | 4 |
| Alabama | 8–0 | 12–2 | 5 |
| Missouri | 6–2 | 11–2 | 8 |
| Ole Miss | 6–2 | 11–2 | |
| LSU | 6–2 | 10–3 | 12 |
 Tennessee | 4–4 | 9–4 | 17 |
| Texas A&M | 4–4 | 7–6 | |
 Kentucky | 3–5 | 7–6 | |
| Auburn | 3–5 | 6–7 | |
 South Carolina | 3–5 | 5–7 | |
| Florida | 3–5 | 5–7 | |
| Mississippi State | 1–7 | 5–7 | 9 |
| Arkansas | 1–7 | 4–8 | |
 Vanderbilt | 0–8 | 2–10 |
Ordered by conference winning percentage, then conference wins. Division splits and tiebreakers aren’t applied.