2022 Mississippi State
9–4 (4–4 Southeastern Conference), coached by Mike Leach, then Zach Arnett (bowl game), finished No. 20 in the AP poll. Share
Schedule and results
- Best winBeat No. 17 Texas A&M 42–24Oct 1
Over the best-ranked team it beat, at home.
- Biggest upsetBeat No. 20 Ole Miss 24–22Nov 24
Ole Miss was ranked No. 20 and favored to win.
- Most excitingBeat Auburn 39–33Nov 5
The win probability swung the most, by CollegeFootballData.com’s excitement index.
| Date | Opponent | Result | Elo |
|---|---|---|---|
| Sep 3 | vs Memphis | W 49–23 | 56% |
| Sep 10 | at Arizona | W 39–17 | 60% |
| Sep 17 | at LSU | L 16–31 | 48% |
| Sep 24 | vs Bowling Green | W 45–14 | 78% |
| Oct 1 | vs 17Texas A&M | W 42–24 | 47% |
| Oct 8 | vs Arkansas | W 40–17 | 58% |
| Oct 15 | at 22Kentucky | L 17–27 | 44% |
| Oct 22 | at 6Alabama | L 6–30 | 20% |
| Nov 5 | vs Auburn | W 39–33 | 72% |
| Nov 12 | vs 1Georgia | L 19–45 | 26% |
| Nov 19 | vs East Tennessee State | W 56–7 | 88% |
| Nov 24 | at 20Ole Miss | W 24–22 | 37% |
| Jan 2Bowls & playoff | vs IllinoisReliaQuest Bowl | W 19–10 | 52% |
Elo: a pregame chance from scores alone.
How it ended: Beat Illinois 19–10 in the ReliaQuest Bowl; No. 20 in the final AP poll; tied for 5th in the Southeastern Conference.
In program history: The 13th-best season in program history by end-of-season Elo (of 124 on file).
AP poll, week by week
- Wk 6: 23
- Wk 7: 16
- Wk 8: 24
- Wk 14: 25
- Wk 15: 24
- Final: 20
Led the nationLiedeatrick Griffin: kickoff return average (32.3)
- Record
- 9–4
- Conference
- 4–4 tied for 5th in Southeastern Conference
- AP final
- No. 20 peak No. 16
- Points
- 411–300
- Coach
- Mike Leach, then Zach Arnett (bowl game)
- Elo
- 1622 +105 this season
- SP+ rating
- 15.4 No. 19 of 131; offense No. 32, defense No. 30, special teams No. 58
- SRS
- 13.1 No. 16 of 131 in FBS
- Returning
- 42% of last season’s EPA, No. 94 of 130
- Recruiting class
- No. 27 roster talent No. 29 in FBS
- Defensive coordinator
- Zach Arnett
- Offense
- Air Raid
- Defense
- 3–3–5
How good, play by play
| EPA per play | Success | Explosiveness | FBS rank | |
|---|---|---|---|---|
| Offense | 0.07 | 45% | 1.10 | 74th of 131 |
| Defense | 0.04 | 40% | 1.25 | 30th of 131 |
| Opponent-adjusted | 0.12 off 0.00 def | 47% off 37% def | — | 55th off 17th def |
How these are measured
Play-weighted averages over games against FBS opponents; raw numbers, not adjusted for the strength of the opponent. EPA (expected points added) measures how much each play changed the expected score; success rate counts plays that kept the offense on schedule; explosiveness is the average EPA on successful plays. Lower is better on defense. Ranked by EPA per play among teams that were FBS that season. The opponent-adjusted row (offense / defense) is CollegeFootballData.com’s WEPA, which accounts for who each team played.
Drives and havoc
| Points per trip inside the 40 | Average start | Havoc | |
|---|---|---|---|
| Offense | 4.2 | own 32 | 16% allowed |
| Defense | 3.5 | own 29 | 18% caused |
CORE rating 9.0, 29th of 131 (offense -2.1, defense -11.1).
A trip inside the 40 is a drive that reaches the opponent’s 40-yard line; points per trip is how many it scored on average (allowed, on defense). Average start is where drives began (the defense’s line is where its opponents started). Havoc is the share of plays ending in a tackle for loss, a forced fumble, an interception or a pass broken up. CORE is CollegeFootballData.com’s context- and opponent-adjusted rating (points better than an average team; lower is better on defense). From CollegeFootballData.com.
Leaders
| Passing yards | Will Rogers QB | 3,963 yds |
| Passing touchdowns | Will Rogers QB | 35 TD |
| Rushing yards | Jo’quavious Marks RB | 582 yds |
| Rushing touchdowns | Jo’quavious Marks RB | 9 TD |
| Receiving yards | Rara Thomas WR | 626 yds |
| Receiving touchdowns | Caleb Ducking WR | 8 TD |
| Tackles | Nathaniel Watson LB | 109 tkl |
| Sacks | Nathaniel Watson LB | 6 sacks |
| Interceptions | Emmanuel Forbes CB | 6 INT |
Top recruits in the 2022 class
| Trevion Williams DL | ★★★★ | No. 187 |
| Mojo Dortch WR | ★★★★ | No. 229 |
| Jacarius Clayton DL | ★★★★ | No. 367 |
| Braedyn Locke QB | ★★★★ | No. 383 |
| Zavion Thomas WR | ★★★★ | No. 391 |
247Sports composite rankings via CollegeFootballData.com; national rank in the class.
The 2022 class by position
| Signed | Stars | Rating | |
|---|---|---|---|
| Quarterbacks | 1 | 4.0 | 0.893 |
| Receivers | 4 | 3.5 | 0.889 |
| Offensive line | 3 | 3.0 | 0.866 |
| Defensive line | 4 | 3.5 | 0.892 |
| Linebackers | 3 | 3.0 | 0.880 |
| Defensive backs | 2 | 3.0 | 0.866 |
| Athletes and specialists | 2 | 3.0 | 0.871 |
| Whole class | 19 | 3.3 | 0.881 |
High-school signees by position group, with their average stars and 247Sports composite rating (out of 1), via CollegeFootballData.com. Athletes are signees with no set position.
Drafted in 2023
The 2023 draft| Rd 1 | Emmanuel Forbes CB | Washington Commanders |
| Rd 4 | Cameron Young DT | Seattle Seahawks |
Roster 114
The 2022 roster114 players, with numbers, heights, hometowns and each player’s 2022 line; 66 have a stat line. See the roster
Transfers in 10
The 2022 portal Jackie Matthews CB | ★★★★ | from  West Virginia |
| Marcus Banks CB | ★★★ | from  Alabama |
 Jordan Mosley WR | ★★★ | from  Northwestern |
| Justin Robinson WR | ★★★ | from  Georgia |
 Steven Losoya III OL | ★★★ | from  Middle Tennessee |
 Hunter Washington CB | ★★★★ | from  Florida State |
 Jordan Morant S | ★★★★ | from  Michigan |
 George Georgopoulos P | ★★ | from  Massachusetts |
 Massimo Biscardi K | ★★ | from  Coastal Carolina |
 Ben Raybon K | from  Northern Colorado |
Transfers out 24
 Aaron Brule LB | ★★★ | to  Michigan State |
| Malik Heath WR | ★★★ | to  Ole Miss |
| Theodore Knox WR | ★★★ | to  SMU |
| Jacobi Moore WR | ★★★ | to Ole Miss |
| Janari Dean S | ★★★ | to  Southern Miss |
| Ani Izuchukwu DE | ★★★ | to  Tulsa |
| Armondous Cooley DL | ★★★ | to Southern Miss |
| Aaron Odom DE | ★★★ | to Southern Miss |
| Calvin McMillian OT | ★★★ | to Southern Miss |
| Jack Abraham QB | ★★★ | to  Missouri |
| Omni Wells RB | ★★★ | to  South Alabama |
| Cameron Threatt CB | ★★★ | to  Akron |
And 12 more, lower-rated or unrated.
All-SEC
2 first team, 2 second teamFirst team
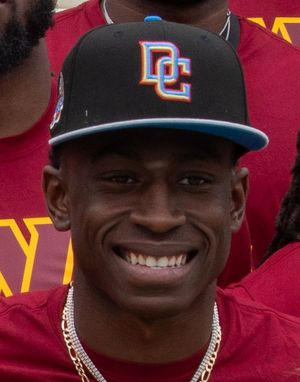 Emmanuel ForbesDBAP-1; Coaches-1
- Lideatrick GriffinAPBAP-1
Second team
- Tyrus WheatDECoaches-2
- Nathaniel WatsonLBAP-2; Coaches-2
From Wikipedia’s 2022 all-conference team article, with the selectors that named each player (AP-1: the Associated Press’s first team).
2022 Southeastern Conference standings
Conference page| Team | Conf. | Overall | AP final |
|---|---|---|---|
| Georgia | 8–0 | 15–0 | 1 |
 Tennessee | 6–2 | 11–2 | 6 |
| Alabama | 6–2 | 11–2 | 5 |
| LSU | 6–2 | 10–4 | 16 |
| Mississippi State | 4–4 | 9–4 | 20 |
| Ole Miss | 4–4 | 8–5 | |
 South Carolina | 4–4 | 8–5 | 23 |
| Arkansas | 3–5 | 7–6 | |
| Kentucky | 3–5 | 7–6 | |
 Florida | 3–5 | 6–7 | |
 Missouri | 3–5 | 6–7 | |
 Vanderbilt | 2–6 | 5–7 | |
| Texas A&M | 2–6 | 5–7 | |
| Auburn | 2–6 | 5–7 |
Ordered by conference winning percentage, then conference wins. Division splits and tiebreakers aren’t applied.