2004 USC
13–0 (8–0 Pac-10), coached by Pete Carroll, finished No. 1 in the AP poll. Officially 11–0: the NCAA vacated one regular-season win and the 2005 Orange Bowl win. Share
From the season’s Wikipedia article: “Since the vacated games included the Trojans’ Orange Bowl win, the Trojans were later stripped of the 2004 BCS title in June 2011.”
Schedule and results
- Best winBeat No. 2 Oklahoma 55–19Jan 4
Over the best-ranked team it beat, at a neutral site.
| Date | Opponent | Result | Elo |
|---|---|---|---|
| Aug 28 | vs Virginia TechBca Classic | W 24–13 | 71% |
| Sep 11 | vs Colorado State | W 49–0 | 83% |
| Sep 18 | at BYU | W 42–10 | 82% |
| Sep 25 | at Stanford | W 31–28 | 78% |
| Oct 9 | vs 7California | W 23–17 | 73% |
| Oct 16 | vs 15Arizona State | W 45–7 | 78% |
| Oct 23 | vs Washington | W 38–0 | 92% |
| Oct 30 | at Washington State | W 42–12 | 75% |
| Nov 6 | at Oregon State | W 28–20 | 74% |
| Nov 13 | vs Arizona | W 49–9 | 95% |
| Nov 27 | vs Notre Dame | W 41–10 | 85% |
| Dec 4 | at UCLA | W 29–24vacated | 77% |
| Jan 4Bowls & playoff | vs 2OklahomaOrange Bowl | W 55–19vacated | 52% |
Elo: a pregame chance from scores alone.
How it ended: Beat Oklahoma 55–19 in the Orange Bowl; No. 1 in the final AP poll; first in the Pac-10.
In program history: The best season in program history by end-of-season Elo (of 112 on file).
AP poll, week by week
- Wk 1: 1
- Wk 3: 1
- Wk 4: 1
- Wk 5: 1
- Wk 6: 1
- Wk 7: 1
- Wk 8: 1
- Wk 9: 1
- Wk 10: 1
- Wk 11: 1
- Wk 12: 1
- Wk 13: 1
- Wk 14: 1
- Wk 15: 1
- Final: 1
National championsNo. 1 in the final AP poll, and a title the school claims
Heisman voteReggie Bush, fifth
Heisman TrophyMatt Leinart, QB; also the Walter Camp and Manning
4 consensus All-AmericansMatt Leinart, QB; Shaun Cody, DL; Matt Grootegoed, LB; Reggie Bush, RB
- Record
- 13–0
- Conference
- 8–0 first in Pac-10
- AP final
- No. 1 peak No. 1
- Points
- 496–169
- Coach
- Pete Carroll
- Elo
- 1884 +152 this season
- SP+ rating
- 32.3 No. 1 of 120; offense No. 5, defense No. 4
- SRS
- 29.1 No. 1 of 119 in Division I-A
- Recruiting class
- No. 2
- Offensive coordinator
- Norm Chow
- Captains
- Shaun Cody, Matt Grootegoed and Matt Leinart
- Offense
- Pro-style
- Defense
- 4–3
How good, play by play
| EPA per play | Success | Explosiveness | FBS rank | |
|---|---|---|---|---|
| Offense | 0.02 | 39% | 0.99 | 22nd of 118 |
| Defense | -0.12 | 33% | 0.96 | 16th of 118 |
How these are measured
Play-weighted averages over games against FBS opponents; raw numbers, not adjusted for the strength of the opponent. EPA (expected points added) measures how much each play changed the expected score; success rate counts plays that kept the offense on schedule; explosiveness is the average EPA on successful plays. Lower is better on defense. Ranked by EPA per play among teams that were FBS that season.
Drives and havoc
| Points per trip inside the 40 | Average start | Havoc | |
|---|---|---|---|
| Offense | 0.0 | own 37 | 1% allowed |
| Defense | -0.1 | own 26 | 3% caused |
A trip inside the 40 is a drive that reaches the opponent’s 40-yard line; points per trip is how many it scored on average (allowed, on defense). Average start is where drives began (the defense’s line is where its opponents started). Havoc is the share of plays ending in a tackle for loss, a forced fumble, an interception or a pass broken up. From CollegeFootballData.com.
Top recruits in the 2004 class
| Keith Rivers ILB | ★★★★★ | No. 7 |
| Jeff Byers OC | ★★★★★ | No. 9 |
| Jeff Schweiger WDE | ★★★★★ | No. 10 |
| Fred Davis WR | ★★★★★ | No. 13 |
| Thomas Herring OT | ★★★★★ | No. 33 |
| Dwayne Jarrett WR | ★★★★★ | No. 38 |
| Scott Ware S | ★★★★ | No. 87 |
| Dale Thompson TE | ★★★★ | No. 93 |
247Sports composite rankings via CollegeFootballData.com; national rank in the class.
The 2004 class by position
| Signed | Stars | Rating | |
|---|---|---|---|
| Receivers | 4 | 4.5 | 0.970 |
| Offensive line | 3 | 4.7 | 0.968 |
| Defensive line | 1 | 5.0 | 0.996 |
| Linebackers | 1 | 5.0 | 0.997 |
| Defensive backs | 1 | 4.0 | 0.967 |
| Whole class | 10 | 4.6 | 0.975 |
High-school signees by position group, with their average stars and 247Sports composite rating (out of 1), via CollegeFootballData.com. Athletes are signees with no set position.
Drafted in 2005
The 2005 draft| Rd 1 | Mike Williams WR | Detroit Lions |
| Rd 1 | Mike Patterson DT | Philadelphia Eagles |
| Rd 2 | Shaun Cody DE | Detroit Lions |
| Rd 2 | Lofa Tatupu LB | Seattle Seahawks |
| Rd 7 | Matt Cassel QB | New England Patriots |
All-Pac-10
7 first team, 4 second teamFirst team
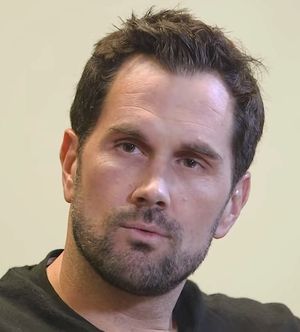 Matt LeinartQBCoaches-1
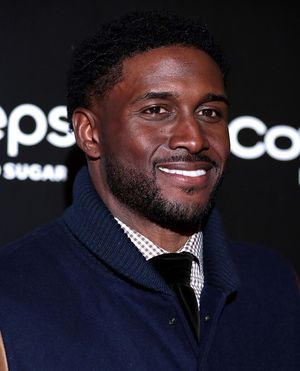 Reggie BushRBCoaches-1
 Mike PattersonDLCoaches-1
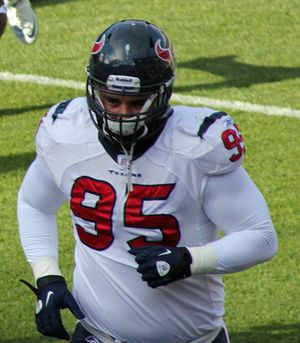 Shaun CodyDLCoaches-1
- Matt GrootegoedLBCoaches-1
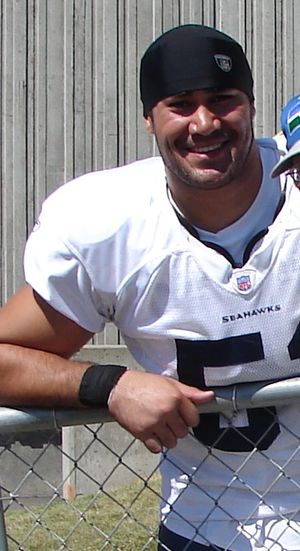 Lofa TatupuLBCoaches-1
- Tom MalonePCoaches-1
Second team
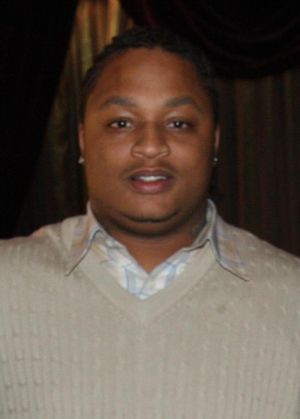 LenDale WhiteRBCoaches-2
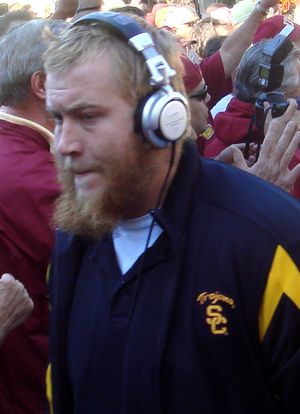 Sam BakerOLCoaches-2
- Darnell BingDBCoaches-2
- Desmond ReedAPBCoaches-2
From Wikipedia’s 2004 all-conference team article, with the selectors that named each player (AP-1: the Associated Press’s first team).
2004 Pac-10 standings
| Team | Conf. | Overall | AP final |
|---|---|---|---|
| USC | 8–0 | 13–0 | 1 |
| California | 7–1 | 10–2 | 9 |
| Arizona State | 5–3 | 9–3 | 19 |
| Oregon State | 5–3 | 7–5 | |
| UCLA | 4–4 | 6–6 | |
 Oregon | 4–4 | 5–6 | |
| Washington State | 3–5 | 5–6 | |
| Stanford | 2–6 | 4–7 | |
| Arizona | 2–6 | 3–8 | |
| Washington | 0–8 | 1–10 |
Ordered by conference winning percentage, then conference wins. Division splits and tiebreakers aren’t applied.