
2003 USC
12–1 (7–1 Pac-10), coached by Pete Carroll, finished No. 1 in the AP poll. Share
Schedule and results
- Best winBeat No. 4 Michigan 28–14Jan 1
Over the best-ranked team it beat, at a neutral site.
| Date | Opponent | Result | Elo |
|---|---|---|---|
| Aug 30 | at Auburn | W 23–0 | 56% |
| Sep 6 | vs BYU | W 35–18 | 82% |
| Sep 13 | vs Hawai’i | W 61–32 | 79% |
| Sep 27 | at California | L 31–34 | 72% |
| Oct 4 | at Arizona State | W 37–17 | 71% |
| Oct 11 | vs Stanford | W 44–21 | 86% |
| Oct 18 | at Notre Dame | W 45–14 | 69% |
| Oct 25 | at Washington | W 43–23 | 70% |
| Nov 1 | vs 6Washington State | W 43–16 | 65% |
| Nov 15 | at Arizona | W 45–0 | 90% |
| Nov 22 | vs UCLA | W 47–22 | 87% |
| Dec 6 | vs Oregon State | W 52–28 | 85% |
| Jan 1Bowls & playoff | vs 4MichiganRose Bowl | W 28–14 | 60% |
Elo: a pregame chance from scores alone.
How it ended: Beat Michigan 28–14 in the Rose Bowl; No. 1 in the final AP poll; Pac-10 champions.
In program history: The 4th-best season in program history by end-of-season Elo (of 112 on file).
AP poll, week by week
- Wk 1: 8
- Wk 3: 4
- Wk 4: 4
- Wk 5: 4
- Wk 6: 3
- Wk 7: 10
- Wk 8: 9
- Wk 9: 5
- Wk 10: 5
- Wk 11: 3
- Wk 12: 2
- Wk 13: 2
- Wk 14: 2
- Wk 15: 2
- Wk 16: 2
- Final: 1
Players on this team
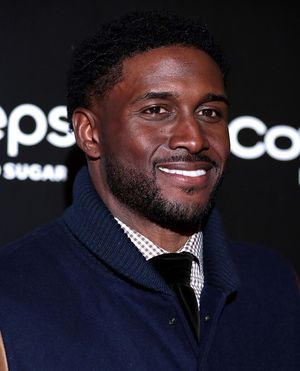 Reggie BushRunning back
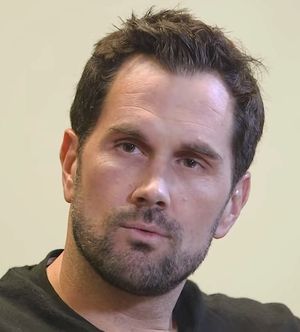 Matt LeinartQuarterback
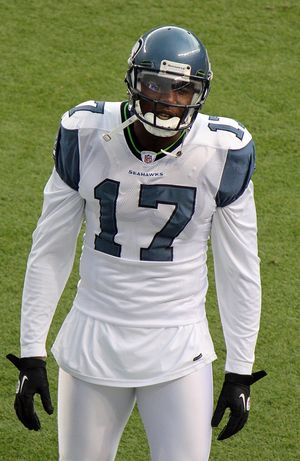 Mike WilliamsReceiver
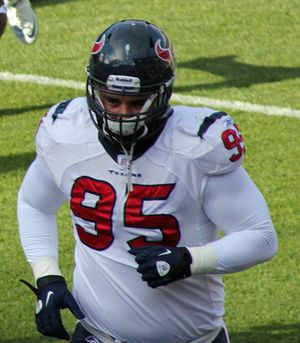 Shaun CodyDefensive line
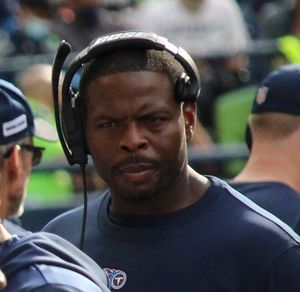 Kenechi UdezeDefensive end
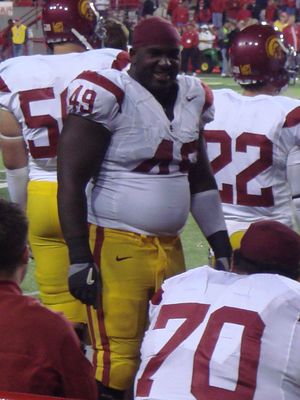 Sedrick EllisDefensive tackle
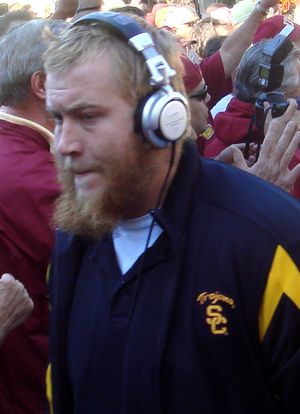 Sam BakerOffensive tackle
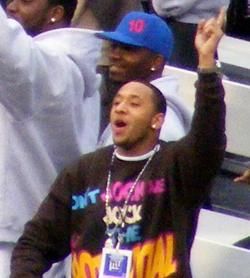 Steve SmithReceiver
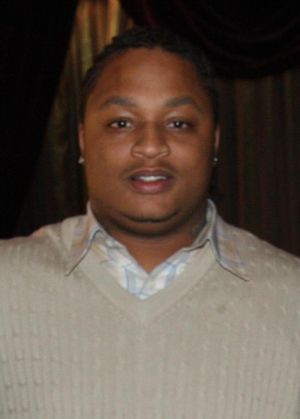 LenDale WhiteRunning back
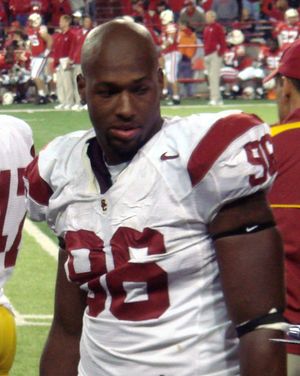 Lawrence JacksonDefensive end
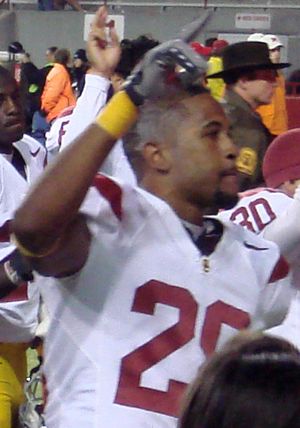 Terrell ThomasCornerback
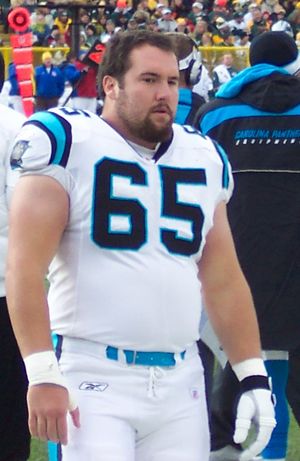 Ryan KalilCenter
Before 2004 our records hold honors and the draft; these are the players whose college years here, from their Wikipedia articles or their honors, include 2003.
National championsNo. 1 in the final AP poll, and a title the school claims
Pac-10 champions7–1 in the conference
3 consensus All-AmericansMike Williams, WR; Jacob Rogers, OT; Kenechi Udeze, DE
- Record
- 12–1
- Conference
- 7–1 first in Pac-10
- AP final
- No. 1 peak No. 1
- Points
- 534–239
- Coach
- Pete Carroll
- Elo
- 1849 +157 this season
- SP+ rating
- 30.1 No. 2 of 117; offense No. 2, defense No. 19
- SRS
- 24.9 No. 1 of 117 in Division I-A
- Recruiting class
- No. 2
- Offensive coordinator
- Norm Chow
- Captains
- Keary Colbert and Melvin Simmons
- Offense
- Pro-style
- Defense
- 4–3
Drives and havoc
| Points per trip inside the 40 | Average start | Havoc | |
|---|---|---|---|
| Offense | -0.1 | own 36 | — allowed |
| Defense | -0.1 | own 28 | — caused |
A trip inside the 40 is a drive that reaches the opponent’s 40-yard line; points per trip is how many it scored on average (allowed, on defense). Average start is where drives began (the defense’s line is where its opponents started). Havoc is the share of plays ending in a tackle for loss, a forced fumble, an interception or a pass broken up. From CollegeFootballData.com.
Top recruits in the 2003 class
| Whitney Lewis WR | ★★★★★ | No. 2 |
| Reggie Bush RB | ★★★★★ | No. 17 |
| Steve Smith ATH | ★★★★ | No. 35 |
| Lawrence Jackson WDE | ★★★★ | No. 39 |
| Chris Barrett TE | ★★★★ | No. 48 |
| Thomas Williams OLB | ★★★★ | No. 117 |
| LenDale White RB | ★★★★ | No. 133 |
247Sports composite rankings via CollegeFootballData.com; national rank in the class.
The 2003 class by position
| Signed | Stars | Rating | |
|---|---|---|---|
| Running backs | 2 | 4.5 | 0.947 |
| Receivers | 2 | 4.5 | 0.988 |
| Defensive line | 1 | 4.0 | 0.982 |
| Linebackers | 1 | 4.0 | 0.932 |
| Athletes and specialists | 1 | 4.0 | 0.983 |
| Whole class | 7 | 4.3 | 0.966 |
High-school signees by position group, with their average stars and 247Sports composite rating (out of 1), via CollegeFootballData.com. Athletes are signees with no set position.
Drafted in 2004
The 2004 draft| Rd 1 | Kenechi Udeze DE | Minnesota Vikings |
| Rd 2 | Jacob Rogers OT | Dallas Cowboys |
| Rd 2 | Keary Colbert WR | Carolina Panthers |
| Rd 4 | Will Poole DB | Miami Dolphins |
All-Pac-10
9 first team, 2 second teamFirst team
- Matt LeinartQBCoaches-1
- Mike WilliamsWRCoaches-1
 Jacob RogersOLCoaches-1
- Norm KatnikOLCoaches-1
- Kenechi UdezeDLCoaches-1
- Shaun CodyDLCoaches-1
- Mike PattersonDLCoaches-1
- Will PooleDBCoaches-1
- Tom MalonePCoaches-1
Second team
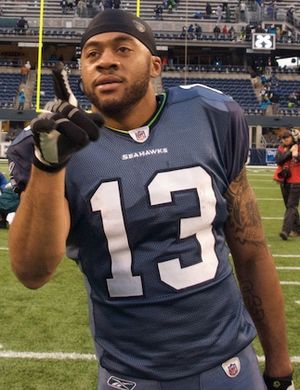 Keary ColbertWRCoaches-2
- Matt GrootegoedLBCoaches-2
From Wikipedia’s 2003 all-conference team article, with the selectors that named each player (AP-1: the Associated Press’s first team).
2003 Pac-10 standings
| Team | Conf. | Overall | AP final |
|---|---|---|---|
| USC | 7–1 | 12–1 | 1 |
| Washington State | 6–2 | 10–3 | 9 |
 Oregon | 5–3 | 8–5 | |
| California | 5–3 | 8–6 | |
| Oregon State | 4–4 | 8–5 | |
| Washington | 4–4 | 6–6 | |
| UCLA | 4–4 | 6–7 | |
| Arizona State | 2–6 | 5–7 | |
| Stanford | 2–6 | 4–7 | |
| Arizona | 1–7 | 2–10 |
Ordered by conference winning percentage, then conference wins. Division splits and tiebreakers aren’t applied.