
2025 Texas
10–3 (6–2 Southeastern Conference), coached by Steve Sarkisian, finished No. 12 in the AP poll. Share
Schedule and results
- Biggest upsetBeat No. 3 Texas A&M 27–17Nov 28
Texas A&M was ranked No. 3 and favored to win.
- Most excitingBeat Mississippi State 45–38Oct 25
The win probability swung the most, by CollegeFootballData.com’s excitement index.
| Date | Opponent | Result | Elo |
|---|---|---|---|
| Aug 30 | at 3Ohio State | L 7–14 | 33% |
| Sep 6 | vs San José State | W 38–7 | 81% |
| Sep 13 | vs UTEP | W 27–10 | 88% |
| Sep 20 | vs Sam Houston | W 55–0 | 86% |
| Oct 4 | at Florida | L 21–29 | 64% |
| Oct 11 | vs 6OklahomaAllstate Red River Rivalry | W 23–6 | 56% |
| Oct 18 | at Kentucky | W 16–13 | 74% |
| Oct 25 | at Mississippi State | W 45–38 | 74% |
| Nov 1 | vs 9Vanderbilt | W 34–31 | 68% |
| Nov 15 | at 5Georgia | L 10–35 | 36% |
| Nov 22 | vs Arkansas | W 52–37 | 84% |
| Nov 28 | vs 3Texas A&M | W 27–17 | 54% |
| Dec 31Bowls & playoff | vs 18MichiganCitrus Bowl | W 41–27 | 58% |
Elo: a pregame chance from scores alone.
How it ended: Beat Michigan 41–27 in the Citrus Bowl; No. 12 in the final AP poll; tied for 5th in the Southeastern Conference.
In program history: The 14th-best season in program history by end-of-season Elo (of 126 on file).
AP poll, week by week
- Wk 1: 1
- Wk 2: 7
- Wk 3: 7
- Wk 4: 8
- Wk 5: 10
- Wk 6: 9
- Wk 8: 21
- Wk 9: 22
- Wk 10: 20
- Wk 11: 13
- Wk 12: 10
- Wk 13: 17
- Wk 14: 16
- Wk 15: 14
- Wk 16: 14
- Final: 12
- Record
- 10–3
- Conference
- 6–2 tied for 5th in Southeastern Conference
- AP final
- No. 12 peak No. 1
- Points
- 396–264
- Coach
- Steve Sarkisian
- Elo
- 1756 +64 this season
- SP+ rating
- 16.2 No. 17 of 136; offense No. 30, defense No. 18, special teams No. 31
- SRS
- 12.6 No. 19 of 136 in FBS
- Returning
- 28% of last season’s EPA, No. 76 of 134
- Recruiting class
- No. 1 roster talent No. 4 in FBS
- Offensive coordinators
- Kyle Flood and A.J. Milwee
- Defensive coordinators
- Pete Kwiatkowski and Johnny Nansen
- Offense
- Pro spread
- Defense
- Multiple 4–2–5
How good, play by play
| EPA per play | Success | Explosiveness | FBS rank | |
|---|---|---|---|---|
| Offense | 0.15 | 41% | 1.39 | 36th of 136 |
| Defense | 0.02 | 39% | 1.12 | 28th of 136 |
| Opponent-adjusted | 0.16 off -0.00 def | 42% off 37% def | — | 35th off 22nd def |
Passing and running
| Pass success | Depth of target | Deep throws | Line yards | Stuffed | |
|---|---|---|---|---|---|
| Offense | 42% | 8.6 yds | 11% | 3.00 | 19% |
| Defense | 42% | 7.5 yds | 8% | 2.80 | 20% |
How these are measured
Play-weighted averages over games against FBS opponents; raw numbers, not adjusted for the strength of the opponent. EPA (expected points added) measures how much each play changed the expected score; success rate counts plays that kept the offense on schedule; explosiveness is the average EPA on successful plays. Lower is better on defense. Ranked by EPA per play among teams that were FBS that season. The opponent-adjusted row (offense / defense) is CollegeFootballData.com’s WEPA, which accounts for who each team played. Passing and running: depth of target is how far downfield passes traveled in the air; deep throws are the share thrown deep, of the passes whose depth and direction the play-by-play describes (about half); line yards are the running yards per carry credited to the blockers; stuffed is the share of carries stopped at or behind the line. The defense’s line is what its opponents did. From CollegeFootballData.com, 2025 on.
Drives and havoc
| Points per trip inside the 40 | Average start | Havoc | |
|---|---|---|---|
| Offense | 3.5 | own 31 | 16% allowed |
| Defense | 3.8 | own 26 | 18% caused |
CORE rating 15.5, 21st of 136 (offense 7.6, defense -7.9).
A trip inside the 40 is a drive that reaches the opponent’s 40-yard line; points per trip is how many it scored on average (allowed, on defense). Average start is where drives began (the defense’s line is where its opponents started). Havoc is the share of plays ending in a tackle for loss, a forced fumble, an interception or a pass broken up. CORE is CollegeFootballData.com’s context- and opponent-adjusted rating (points better than an average team; lower is better on defense). From CollegeFootballData.com.
Leaders
| Passing yards | Arch Manning QB | 3,163 yds |
| Passing touchdowns | Arch Manning QB | 26 TD |
| Rushing yards | Tre Wisner RB | 597 yds |
| Rushing touchdowns | Arch Manning QB | 10 TD |
| Receiving yards | Ryan Wingo WR | 834 yds |
| Receiving touchdowns | Ryan Wingo WR | 7 TD |
| Tackles | Jelani McDonald DB | 80 tkl |
| Sacks | Colin Simmons DE | 12 sacks |
| Interceptions | Jelani McDonald DB | 3 INT |
Top recruits in the 2025 class
| Jonah Williams S | ★★★★★ | No. 10 |
| Justus Terry DL | ★★★★★ | No. 12 |
| Kaliq Lockett WR | ★★★★★ | No. 18 |
| Lance Jackson DE | ★★★★★ | No. 21 |
| Kade Phillips CB | ★★★★★ | No. 27 |
| Jaime Ffrench Jr. WR | ★★★★ | No. 44 |
| Michael Terry III ATH | ★★★★ | No. 58 |
| Graceson Littleton CB | ★★★★ | No. 65 |
247Sports composite rankings via CollegeFootballData.com; national rank in the class.
The 2025 class by position
| Signed | Stars | Rating | |
|---|---|---|---|
| Quarterbacks | 1 | 4.0 | 0.934 |
| Running backs | 2 | 4.0 | 0.912 |
| Receivers | 5 | 4.0 | 0.951 |
| Offensive line | 4 | 3.3 | 0.884 |
| Defensive line | 5 | 4.4 | 0.959 |
| Linebackers | 2 | 3.5 | 0.928 |
| Defensive backs | 5 | 4.2 | 0.948 |
| Athletes and specialists | 1 | 4.0 | 0.970 |
| Whole class | 25 | 4.0 | 0.936 |
High-school signees by position group, with their average stars and 247Sports composite rating (out of 1), via CollegeFootballData.com. Athletes are signees with no set position.
Drafted in 2026
The 2026 draft| Rd 2 | Anthony Hill Jr. LB | Tennessee Titans |
| Rd 4 | Malik Muhammad CB | Chicago Bears |
| Rd 4 | Trey Moore DE | Miami Dolphins |
| Rd 5 | Michael Taaffe S | Miami Dolphins |
| Rd 6 | D.J. Campbell OG | Miami Dolphins |
| Rd 7 | Jack Endries TE | Cincinnati Bengals |
Roster 111
The 2025 roster111 players, with numbers, heights, hometowns and each player’s 2025 line; 67 have a stat line. See the roster
Transfers in 11
The 2025 portal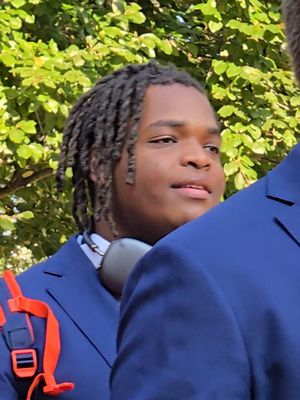 Maraad Watson DL | ★★★★ | from  Syracuse |
 Jack Endries TE | ★★★★ | from  California |
 Travis Shaw DL | ★★★★ | from  North Carolina |
| Hero Kanu DL | ★★★ | from  Ohio State |
 Lavon Johnson DL | ★★★ | from  Maryland |
 Cole Brevard DL | ★★★ | from  Purdue |
 Emmett Mosley V WR | ★★★ | from  Stanford |
| Brad Spence LB | ★★★ | from  Arkansas |
 Matthew Caldwell QB | ★★★ | from  Troy |
 Jack Bouwmeester P | ★★★ | from  Utah |
 Mason Shipley K | from  Texas State |
Transfers out 13
 Derion Gullette LB | ★★★ | to  Mississippi State |
| Amari Niblack TE | ★★★ | to  Texas A&M |
| Jaray Bledsoe DL | ★★★ | to Mississippi State |
| Justice Finkley DE | ★★★ | to  Kansas |
| Sydir Mitchell DL | ★★★ | to  LSU |
| Aaron Bryant DL | ★★★ | to  Vanderbilt |
| Jay’Vion Cole CB | ★★★ | to  Arizona |
| Malik Agbo OT | ★★★ | to  West Virginia |
| Tausili Akana DE | ★★★ | to  BYU |
| Tiaoalil Savea DL | ★★★ | to Arizona |
| Freddie Dubose WR | ★★★ | no new school on file |
| Michael Kern P | ★★★ | to California |
And 1 more, lower-rated or unrated.
All-SEC
5 first team, 3 second teamFirst team
- D.J. CampbellOLAP-1; Coaches-3
- Trevor GoosbyOLAP-2; Coaches-1
- Colin SimmonsDLAP-1; Coaches-1
- Anthony Hill Jr.LBAP-1; Coaches-2
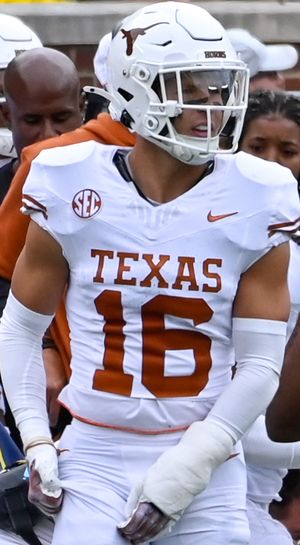 Michael TaaffeDBAP-2; Coaches-1
Second team
- Ryan WingoWRCoaches-2
- Malik MuhammadDBCoaches-2
- Ryan NiblettAPBAP-2; Coaches-2
From Wikipedia’s 2025 all-conference team article, with the selectors that named each player (AP-1: the Associated Press’s first team).
2025 Southeastern Conference standings
Conference page| Team | Conf. | Overall | AP final |
|---|---|---|---|
 Ole Miss | 7–1 | 13–2 | 3 |
| Georgia | 7–1 | 12–2 | 6 |
| Texas A&M | 7–1 | 11–2 | 8 |
 Alabama | 7–1 | 11–4 | 9 |
| Texas | 6–2 | 10–3 | 12 |
| Oklahoma | 6–2 | 10–3 | 13 |
| Vanderbilt | 6–2 | 10–3 | 15 |
 Missouri | 4–4 | 8–5 | |
 Tennessee | 4–4 | 8–5 | |
 LSU | 3–5 | 7–6 | |
| Kentucky | 2–6 | 5–7 | |
| Florida | 2–6 | 4–8 | |
 Auburn | 1–7 | 5–7 | |
| Mississippi State | 1–7 | 5–8 | |
 South Carolina | 1–7 | 4–8 | |
| Arkansas | 0–8 | 2–10 |
Ordered by conference winning percentage, then conference wins. Division splits and tiebreakers aren’t applied.