
2023 Texas
12–2 (8–1 Big 12), coached by Steve Sarkisian, finished No. 3 in the AP poll. Share
Schedule and results
- Biggest upsetBeat No. 3 Alabama 34–24Sep 9
Alabama was ranked No. 3 and favored to win.
- Most excitingLost to No. 12 Oklahoma 30–34Oct 7
The win probability swung the most, by CollegeFootballData.com’s excitement index.
| Date | Opponent | Result | Elo |
|---|---|---|---|
| Sep 2 | vs Rice | W 37–10 | 81% |
| Sep 9 | at 3Alabama | W 34–24 | 26% |
| Sep 16 | vs Wyoming | W 31–10 | 76% |
| Sep 23 | at Baylor | W 38–6 | 65% |
| Sep 30 | vs 24Kansas | W 40–14 | 76% |
| Oct 7 | vs 12OklahomaAllstate Red River Rivalry | L 30–34 | 54% |
| Oct 21 | at Houston | W 31–24 | 64% |
| Oct 28 | vs BYU | W 35–6 | 72% |
| Nov 4 | vs 25Kansas State | W 33–30 | 60% |
| Nov 11 | at TCU | W 29–26 | 62% |
| Nov 18 | at Iowa State | W 26–16 | 61% |
| Nov 24 | vs Texas Tech | W 57–7 | 79% |
| Dec 2 | vs 19Oklahoma StateDr Pepper Big 12 Championship | W 49–21 | 72% |
| Jan 1Bowls & playoff | vs 2WashingtonSugar Bowl, CFP Semifinal | L 31–37 | 50% |
Elo: a pregame chance from scores alone.
How it ended: Lost to Washington 37–31 in the Sugar Bowl, CFP Semifinal; No. 3 in the final AP poll; Big 12 champions.
In program history: The 12th-best season in program history by end-of-season Elo (of 126 on file).
AP poll, week by week
- Wk 1: 11
- Wk 2: 11
- Wk 3: 4
- Wk 4: 3
- Wk 5: 3
- Wk 6: 3
- Wk 7: 9
- Wk 8: 8
- Wk 9: 7
- Wk 10: 7
- Wk 11: 7
- Wk 12: 7
- Wk 13: 7
- Wk 14: 7
- Wk 15: 3
- Final: 3
Big 12 champions8–1 in the conference
Led the nationXavier Worthy: punt return yards (371 yds)
- Record
- 12–2
- Conference
- 8–1 first in Big 12
- AP final
- No. 3 peak No. 3
- Points
- 501–265
- Coach
- Steve Sarkisian
- Elo
- 1765 +168 this season
- SP+ rating
- 23.2 No. 6 of 133; offense No. 6, defense No. 12, special teams No. 15
- SRS
- 21.8 No. 5 of 133 in FBS
- Returning
- 61% of last season’s EPA, No. 52 of 131
- Recruiting class
- No. 3 roster talent No. 6 in FBS
- Offensive coordinators
- Kyle Flood and A.J. Milwee
- Defensive coordinators
- Pete Kwiatkowski and Jeff Choate
- Offense
- Spread
- Defense
- 4–2–5
How good, play by play
| EPA per play | Success | Explosiveness | FBS rank | |
|---|---|---|---|---|
| Offense | 0.20 | 46% | 1.26 | 22nd of 133 |
| Defense | 0.01 | 38% | 1.32 | 20th of 133 |
| Opponent-adjusted | 0.21 off -0.00 def | 47% off 36% def | — | 18th off 12th def |
How these are measured
Play-weighted averages over games against FBS opponents; raw numbers, not adjusted for the strength of the opponent. EPA (expected points added) measures how much each play changed the expected score; success rate counts plays that kept the offense on schedule; explosiveness is the average EPA on successful plays. Lower is better on defense. Ranked by EPA per play among teams that were FBS that season. The opponent-adjusted row (offense / defense) is CollegeFootballData.com’s WEPA, which accounts for who each team played.
Drives and havoc
| Points per trip inside the 40 | Average start | Havoc | |
|---|---|---|---|
| Offense | 3.9 | own 31 | 15% allowed |
| Defense | 3.5 | own 26 | 18% caused |
CORE rating 21.8, 8th of 133 (offense 8.1, defense -13.7).
A trip inside the 40 is a drive that reaches the opponent’s 40-yard line; points per trip is how many it scored on average (allowed, on defense). Average start is where drives began (the defense’s line is where its opponents started). Havoc is the share of plays ending in a tackle for loss, a forced fumble, an interception or a pass broken up. CORE is CollegeFootballData.com’s context- and opponent-adjusted rating (points better than an average team; lower is better on defense). From CollegeFootballData.com.
Leaders
| Passing yards | Quinn Ewers QB | 3,479 yds |
| Passing touchdowns | Quinn Ewers QB | 22 TD |
| Rushing yards | Jonathon Brooks RB | 1,139 yds |
| Rushing touchdowns | Jonathon Brooks RB | 10 TD |
| Receiving yards | Xavier Worthy WR | 1,014 yds |
| Receiving touchdowns | Adonai Mitchell WR | 11 TD |
| Tackles | Jaylan Ford LB | 96 tkl |
| Sacks | Anthony Hill Jr. LB | 5 sacks |
| Interceptions | Jerrin Thompson S | 3 INT |
Top recruits in the 2023 class
| Arch Manning QB | ★★★★★ | No. 1 |
| Anthony Hill Jr. LB | ★★★★★ | No. 18 |
| C.J. Baxter RB | ★★★★★ | No. 23 |
| Johntay Cook WR | ★★★★★ | No. 30 |
| Malik Muhammad CB | ★★★★ | No. 46 |
| Derek Williams Jr. S | ★★★★ | No. 49 |
| Ryan Niblett WR | ★★★★ | No. 65 |
| Jelani McDonald ATH | ★★★★ | No. 70 |
247Sports composite rankings via CollegeFootballData.com; national rank in the class.
The 2023 class by position
| Signed | Stars | Rating | |
|---|---|---|---|
| Quarterbacks | 1 | 5.0 | 1.000 |
| Running backs | 2 | 4.0 | 0.938 |
| Receivers | 5 | 3.8 | 0.929 |
| Offensive line | 5 | 3.4 | 0.890 |
| Defensive line | 4 | 3.8 | 0.926 |
| Linebackers | 5 | 4.0 | 0.906 |
| Defensive backs | 3 | 4.0 | 0.956 |
| Athletes and specialists | 1 | 4.0 | 0.967 |
| Whole class | 26 | 3.8 | 0.925 |
High-school signees by position group, with their average stars and 247Sports composite rating (out of 1), via CollegeFootballData.com. Athletes are signees with no set position.
Drafted in 2024
The 2024 draft| Rd 1 | Byron Murphy II DT | Seattle Seahawks |
| Rd 1 | Xavier Worthy WR | Kansas City Chiefs |
| Rd 2 | T’Vondre Sweat DT | Tennessee Titans |
| Rd 2 | Jonathon Brooks RB | Carolina Panthers |
| Rd 2 | Adonai Mitchell WR | Indianapolis Colts |
| Rd 4 | Ja’Tavion Sanders TE | Carolina Panthers |
| Rd 5 | Christian Jones OT | Arizona Cardinals |
| Rd 5 | Keilan Robinson RB | Jacksonville Jaguars |
| Rd 5 | Jaylan Ford LB | New Orleans Saints |
| Rd 6 | Ryan Watts CB | Pittsburgh Steelers |
| Rd 6 | Jordan Whittington WR | Los Angeles Rams |
Roster 119
The 2023 roster119 players, with numbers, heights, hometowns and each player’s 2023 line; 59 have a stat line. See the roster
Transfers in 5
The 2023 portal Adonai Mitchell WR | ★★★★★ | from  Georgia |
 Gavin Holmes CB | ★★★★ | from  Wake Forest |
 Jalen Catalon S | ★★★★ | from  Arkansas |
 Deangelo Carter DL | ★★★ | from  Minnesota |
 Ryan Sanborn P | ★★★ | from  Stanford |
Transfers out 20
 Hudson Card QB | ★★★★ | to  Purdue |
| Brenen Thompson WR | ★★★★ | to  Oklahoma |
| Junior Angilau OL | ★★★★ | to  Oregon |
| Andrej Karic OT | ★★★ | to  Tennessee |
| Ovie Oghoufo DE | ★★★ | to  LSU |
| Derrick Brown LB | ★★★ | to  Texas State |
| Jamier Johnson CB | ★★★ | to  Indiana |
| Logan Parr OL | ★★★ | to  SMU |
| Troy Omeire WR | ★★★ | to  Arizona State |
| Jaden Alexis WR | ★★★ | to  South Florida |
| Jaylen Garth OT | ★★★ | to  Houston |
| Prince Dorbah DE | ★★★ | to Arizona State |
And 8 more, lower-rated or unrated.
All-Big 12
7 first team, 4 second teamFirst team
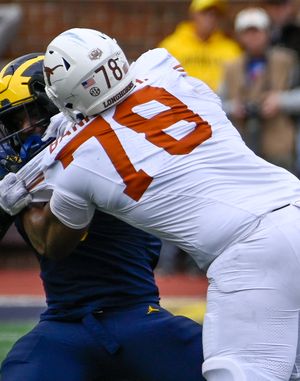 Kelvin Banks Jr.OTCoaches-1; Media-2
- Ja’Tavion SandersTECoaches-1
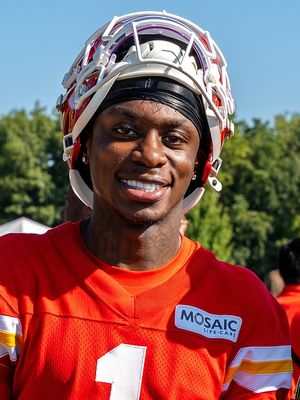 Xavier WorthyWRCoaches-1; Media-1
- Byron Murphy IIDLCoaches-1; Media-1
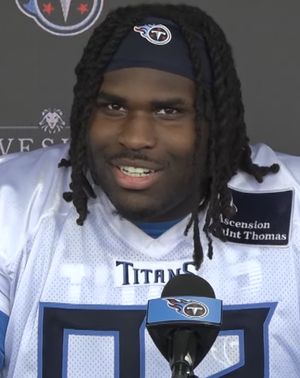 T’Vondre SweatDLCoaches-1; Media-1
- Jaylan FordLBCoaches-1; Media-1
- Bert AuburnKCoaches-1; Media-1
Second team
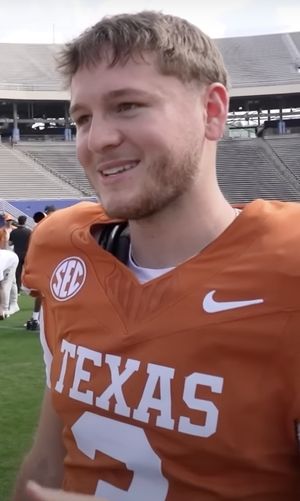 Quinn EwersQBMedia-2
- Jonathon BrooksRBCoaches-2; Media-2
- Adonai MitchellWRCoaches-2; Media-2
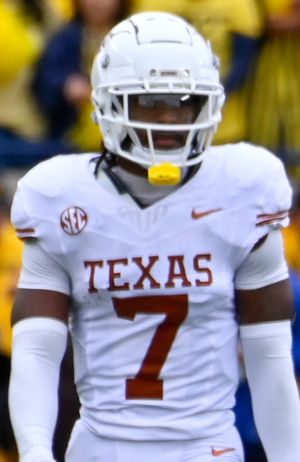 Jahdae BarronDBCoaches-2
From Wikipedia’s 2023 all-conference team article, with the selectors that named each player (AP-1: the Associated Press’s first team).
2023 Big 12 standings
| Team | Conf. | Overall | AP final |
|---|---|---|---|
| Texas | 8–1 | 12–2 | 3 |
| Oklahoma | 7–2 | 10–3 | 15 |
| Oklahoma State | 7–2 | 10–4 | 16 |
 West Virginia | 6–3 | 9–4 | |
| Kansas State | 6–3 | 9–4 | 18 |
| Iowa State | 6–3 | 7–6 | |
| Kansas | 5–4 | 9–4 | 23 |
| Texas Tech | 5–4 | 7–6 | |
 UCF | 3–6 | 6–7 | |
| TCU | 3–6 | 5–7 | |
| BYU | 2–7 | 5–7 | |
| Houston | 2–7 | 4–8 | |
| Baylor | 2–7 | 3–9 | |
 Cincinnati | 1–8 | 3–9 |
Ordered by conference winning percentage, then conference wins. Division splits and tiebreakers aren’t applied.