
2022 Texas
8–5 (6–3 Big 12), coached by Steve Sarkisian, finished No. 25 in the AP poll. Share
Schedule and results
- Best winBeat No. 13 Kansas State 34–27Nov 5
Over the best-ranked team it beat, on the road.
- Most excitingLost to Texas Tech 34–37Sep 24
The win probability swung the most, by CollegeFootballData.com’s excitement index.
| Date | Opponent | Result | Elo |
|---|---|---|---|
| Sep 3 | vs UL Monroe | W 52–10 | 76% |
| Sep 10 | vs 1Alabama | L 19–20 | 29% |
| Sep 17 | vs UTSA | W 41–20 | 56% |
| Sep 24 | at Texas Tech | L 34–37 | 49% |
| Oct 1 | vs West Virginia | W 38–20 | 64% |
| Oct 8 | vs Oklahoma | W 49–0 | 44% |
| Oct 15 | vs Iowa State | W 24–21 | 65% |
| Oct 22 | at 11Oklahoma State | L 34–41 | 33% |
| Nov 5 | at 13Kansas State | W 34–27 | 40% |
| Nov 12 | vs 4TCU | L 10–17 | 53% |
| Nov 19 | at Kansas | W 55–14 | 63% |
| Nov 25 | vs Baylor | W 38–27 | 62% |
| Dec 29Bowls & playoff | vs 12WashingtonAlamo Bowl | L 20–27 | 55% |
Elo: a pregame chance from scores alone.
How it ended: Lost to Washington 27–20 in the Alamo Bowl; No. 25 in the final AP poll; 3rd in the Big 12.
In program history: The 60th-best season in program history by end-of-season Elo (of 126 on file).
AP poll, week by week
- Wk 3: 21
- Wk 4: 22
- Wk 7: 22
- Wk 8: 20
- Wk 11: 18
- Wk 13: 24
- Wk 14: 21
- Wk 15: 21
- Final: 25
- Record
- 8–5
- Conference
- 6–3 3rd in Big 12
- AP final
- No. 25 peak No. 18
- Points
- 448–281
- Coach
- Steve Sarkisian
- Elo
- 1645 +113 this season
- SP+ rating
- 23.1 No. 7 of 131; offense No. 20, defense No. 14, special teams No. 38
- SRS
- 17.1 No. 7 of 131 in FBS
- Returning
- 56% of last season’s EPA, No. 69 of 130
- Recruiting class
- No. 5 roster talent No. 6 in FBS
- Offensive coordinator
- Kyle Flood
- Defensive coordinators
- Pete Kwiatkowski and Jeff Choate
How good, play by play
| EPA per play | Success | Explosiveness | FBS rank | |
|---|---|---|---|---|
| Offense | 0.23 | 47% | 1.21 | 14th of 131 |
| Defense | 0.07 | 39% | 1.27 | 42nd of 131 |
| Opponent-adjusted | 0.22 off 0.04 def | 48% off 38% def | — | 14th off 29th def |
How these are measured
Play-weighted averages over games against FBS opponents; raw numbers, not adjusted for the strength of the opponent. EPA (expected points added) measures how much each play changed the expected score; success rate counts plays that kept the offense on schedule; explosiveness is the average EPA on successful plays. Lower is better on defense. Ranked by EPA per play among teams that were FBS that season. The opponent-adjusted row (offense / defense) is CollegeFootballData.com’s WEPA, which accounts for who each team played.
Drives and havoc
| Points per trip inside the 40 | Average start | Havoc | |
|---|---|---|---|
| Offense | 4.4 | own 30 | 11% allowed |
| Defense | 3.0 | own 30 | 16% caused |
CORE rating 15.5, 11th of 131 (offense 7.9, defense -7.7).
A trip inside the 40 is a drive that reaches the opponent’s 40-yard line; points per trip is how many it scored on average (allowed, on defense). Average start is where drives began (the defense’s line is where its opponents started). Havoc is the share of plays ending in a tackle for loss, a forced fumble, an interception or a pass broken up. CORE is CollegeFootballData.com’s context- and opponent-adjusted rating (points better than an average team; lower is better on defense). From CollegeFootballData.com.
Leaders
| Passing yards | Quinn Ewers QB | 2,128 yds |
| Passing touchdowns | Quinn Ewers QB | 15 TD |
| Rushing yards | Bijan Robinson RB | 1,578 yds |
| Rushing touchdowns | Bijan Robinson RB | 18 TD |
| Receiving yards | Xavier Worthy WR | 760 yds |
| Receiving touchdowns | Xavier Worthy WR | 9 TD |
| Tackles | Jaylan Ford LB | 109 tkl |
| Sacks | Barryn Sorrell LB | 5.5 sacks |
| Interceptions | Jaylan Ford LB | 4 INT |
Top recruits in the 2022 class
| D.J. Campbell OL | ★★★★★ | No. 10 |
| Kelvin Banks Jr. OT | ★★★★★ | No. 33 |
| Terrance Brooks CB | ★★★★ | No. 83 |
| Neto Umeozulu OL | ★★★★ | No. 91 |
| J’Mond Tapp DE | ★★★★ | No. 107 |
| Justice Finkley DE | ★★★★ | No. 116 |
| B.J. Allen Jr. S | ★★★★ | No. 125 |
| Brenen Thompson WR | ★★★★ | No. 131 |
247Sports composite rankings via CollegeFootballData.com; national rank in the class.
The 2022 class by position
| Signed | Stars | Rating | |
|---|---|---|---|
| Quarterbacks | 1 | 4.0 | 0.929 |
| Running backs | 2 | 3.5 | 0.866 |
| Receivers | 1 | 4.0 | 0.948 |
| Offensive line | 7 | 4.1 | 0.930 |
| Defensive line | 8 | 4.0 | 0.916 |
| Linebackers | 1 | 3.0 | 0.883 |
| Defensive backs | 5 | 4.0 | 0.933 |
| Athletes and specialists | 4 | 2.8 | 0.835 |
| Whole class | 29 | 3.8 | 0.908 |
High-school signees by position group, with their average stars and 247Sports composite rating (out of 1), via CollegeFootballData.com. Athletes are signees with no set position.
Drafted in 2023
The 2023 draft| Rd 1 | Bijan Robinson RB | Atlanta Falcons |
| Rd 3 | DeMarvion Overshown ILB | Dallas Cowboys |
| Rd 4 | Roschon Johnson RB | Chicago Bears |
| Rd 6 | Keondre Coburn DT | Kansas City Chiefs |
| Rd 7 | Moro Ojomo DE | Philadelphia Eagles |
Roster 124
The 2022 roster124 players, with numbers, heights, hometowns and each player’s 2022 line; 67 have a stat line. See the roster
Transfers in 7
The 2022 portal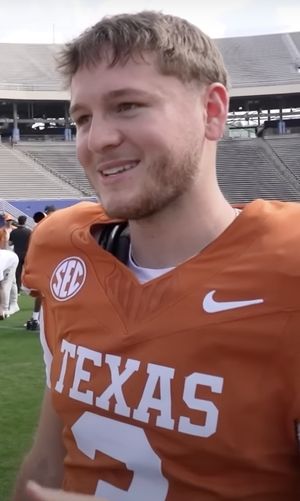 Quinn Ewers QB | ★★★★★ | from  Ohio State |
 Isaiah Neyor WR | ★★★★ | from  Wyoming |
| Jahleel Billingsley TE | ★★★★ | from  Alabama |
| Agiye Hall WR | ★★★★ | from Alabama |
 Ryan Watts CB | ★★★ | from Ohio State |
 Diamonte Tucker-Dorsey LB | ★★★ | from  James Madison |
| Tarique Milton WR | ★★★ | from  Iowa State |
Transfers out 23
 Casey Thompson QB | ★★★ | to  Nebraska |
| Terrence Cooks II LB | ★★★ | to  TCU |
| Chris Adimora S | ★★★ | to  SMU |
| Jared Wiley TE | ★★★ | to TCU |
| Kelvontay Dixon WR | ★★★ | to SMU |
| Marcus Washington WR | ★★★ | to Nebraska |
| David Abiara SDE | ★★★ | to SMU |
| Joshua Moore WR | ★★★ | no new school on file |
| B.J. Foster S | ★★★ | to  Sam Houston |
| Ayodele Adeoye LB | ★★★ | to  Sacramento State |
| Rafiti Ghirmai OL | ★★★ | no new school on file |
| Marcus Tillman Jr. LB | ★★★ | to Navarro College |
And 11 more, lower-rated or unrated.
All-Big 12
4 first team, 4 second teamFirst team
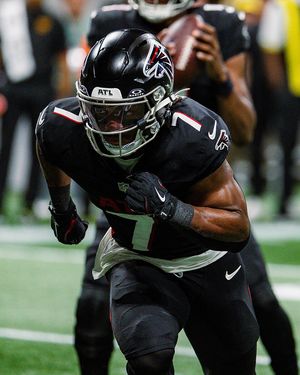 Bijan RobinsonRBCoaches-1; Media-1
- Ja’Tavion SandersTECoaches-1; Media-1
- Jaylan FordLBCoaches-1; Media-1
- DeMarvion OvershownLBCoaches-1; Media-1
Second team
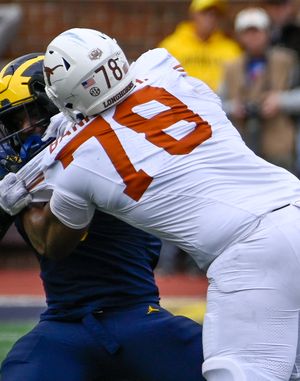 Kelvin Banks Jr.OTCoaches-2; Media-2
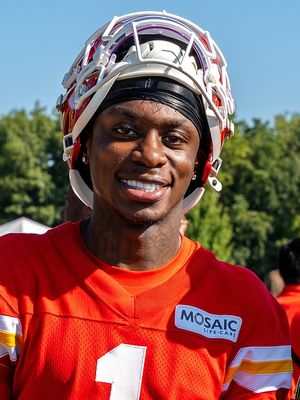 Xavier WorthyWRCoaches-2; Media-2
- Keondre CoburnDLCoaches-2; Media-2
- Moro OjomoDLMedia-2
From Wikipedia’s 2022 all-conference team article, with the selectors that named each player (AP-1: the Associated Press’s first team).
2022 Big 12 standings
| Team | Conf. | Overall | AP final |
|---|---|---|---|
| TCU | 9–0 | 13–2 | 2 |
| Kansas State | 7–2 | 10–4 | 14 |
| Texas | 6–3 | 8–5 | 25 |
| Texas Tech | 5–4 | 8–5 | |
| Oklahoma State | 4–5 | 7–6 | |
| Baylor | 4–5 | 6–7 | |
| Kansas | 3–6 | 6–7 | |
| Oklahoma | 3–6 | 6–7 | |
| West Virginia | 3–6 | 5–7 | |
| Iowa State | 1–8 | 4–8 |
Ordered by conference winning percentage, then conference wins. Division splits and tiebreakers aren’t applied.