2003 Nebraska
10–3 (5–3 Big 12), coached by Frank Solich, then Bo Pelini (interim, bowl game), finished No. 19 in the AP poll. Share
Schedule and results
- Biggest winBeat Texas A&M 48–12Oct 18
By 36 points, its widest win.
| Date | Opponent | Result | Elo |
|---|---|---|---|
| Aug 30 | vs Oklahoma State | W 17–7 | 57% |
| Sep 6 | vs Utah State | W 31–7 | 78% |
| Sep 13 | vs Penn State | W 18–10 | 58% |
| Sep 25 | at Southern Miss | W 38–14 | 52% |
| Oct 4 | vs Troy | W 30–0 | 75% |
| Oct 11 | at Missouri | L 24–41 | 60% |
| Oct 18 | vs Texas A&M | W 48–12 | 69% |
| Oct 25 | vs Iowa State | W 28–0 | 79% |
| Nov 1 | at 16Texas | L 7–31 | 34% |
| Nov 8 | at Kansas | W 24–3 | 68% |
| Nov 15 | vs Kansas State | L 9–38 | 51% |
| Nov 28 | at Colorado | W 31–22 | 49% |
| Dec 29Bowls & playoff | vs Michigan StateAlamo Bowl | W 17–3 | 57% |
Elo: a pregame chance from scores alone.
How it ended: Beat Michigan State 17–3 in the Alamo Bowl; No. 19 in the final AP poll; tied for 4th in the Big 12.
In program history: The tied 58th-best season in program history by end-of-season Elo (of 129 on file).
AP poll, week by week
- Wk 3: 23
- Wk 4: 18
- Wk 5: 15
- Wk 6: 15
- Wk 7: 12
- Wk 8: 10
- Wk 9: 18
- Wk 10: 14
- Wk 11: 12
- Wk 12: 19
- Wk 13: 18
- Wk 14: 23
- Wk 15: 25
- Wk 16: 23
- Final: 19
Players on this team
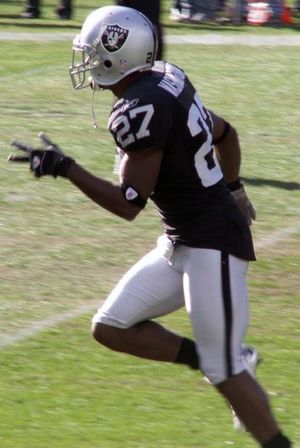 Fabian WashingtonDefensive back
- Adam CarrikerDefensive end
- Jay MooreLinebacker
- Jammal LordRunning back
- Sam KellerQuarterback
Before 2004 our records hold honors and the draft; these are the players whose college years here, from their Wikipedia articles or their honors, include 2003.
- Record
- 10–3
- Conference
- 5–3 tied for 4th in Big 12
- AP final
- No. 19 peak No. 10
- Points
- 322–188
- Coach
- Frank Solich, then Bo Pelini (interim, bowl game)
- Elo
- 1644 +106 this season
- SP+ rating
- 14.7 No. 27 of 117; offense No. 74, defense No. 5
- SRS
- 11.1 No. 20 of 117 in Division I-A
- Recruiting class
- No. 35
- Offensive coordinator
- Barney Cotton
- Defensive coordinator
- Bo Pelini
- Offense
- I formation
- Defense
- 4–3
Drives and havoc
| Points per trip inside the 40 | Average start | Havoc | |
|---|---|---|---|
| Offense | 0.0 | own 36 | — allowed |
| Defense | 0.0 | own 28 | — caused |
A trip inside the 40 is a drive that reaches the opponent’s 40-yard line; points per trip is how many it scored on average (allowed, on defense). Average start is where drives began (the defense’s line is where its opponents started). Havoc is the share of plays ending in a tackle for loss, a forced fumble, an interception or a pass broken up. From CollegeFootballData.com.
Top recruits in the 2003 class
| Adrain Turner CB | ★★★ | No. 682 |
| Andy Birkel WR | ★★★ | No. 682 |
| J.B. Phillips TE | ★★★ | No. 682 |
| Tierre Green S | ★★ | No. 1050 |
| Greg Austin OG | ★★ | No. 1050 |
247Sports composite rankings via CollegeFootballData.com; national rank in the class.
The 2003 class by position
| Signed | Stars | Rating | |
|---|---|---|---|
| Receivers | 2 | 3.0 | 0.800 |
| Offensive line | 1 | 2.0 | 0.767 |
| Defensive backs | 2 | 2.5 | 0.783 |
| Whole class | 5 | 2.6 | 0.787 |
High-school signees by position group, with their average stars and 247Sports composite rating (out of 1), via CollegeFootballData.com. Athletes are signees with no set position.
Drafted in 2004
The 2004 draft| Rd 4 | Demorrio Williams LB | Atlanta Falcons |
| Rd 6 | Jammal Lord RB | Houston Texans |
| Rd 6 | Josh Sewell C | Denver Broncos |
| Rd 7 | Ryon Bingham DT | San Diego Chargers |
| Rd 7 | Trevor Johnson DE | New York Jets |
All-Big 12
5 first team, 2 second teamFirst team
 Richie IncognitoOTCoaches-2; Media-1
- Matt HerianTECoaches-1; Media-2
- Demorrio WilliamsLBCoaches-2; Media-1
- Josh BullocksDBCoaches-1; Media-1
- Kyle LarsonPCoaches-1; Media-1
Second team
- Ryon BinghamDLCoaches-2
- Barrett RuudLBMedia-2
From Wikipedia’s 2003 all-conference team article, with the selectors that named each player (AP-1: the Associated Press’s first team).
2003 Big 12 standings
| Team | Conf. | Overall | AP final |
|---|---|---|---|
 Oklahoma | 8–0 | 12–2 | 3 |
| Texas | 7–1 | 10–3 | 12 |
| Kansas State | 6–2 | 11–4 | 14 |
| Nebraska | 5–3 | 10–3 | 19 |
| Oklahoma State | 5–3 | 9–4 | |
| Missouri | 4–4 | 8–5 | |
 Texas Tech | 4–4 | 8–5 | |
| Kansas | 3–5 | 6–7 | |
| Colorado | 3–5 | 5–7 | |
| Texas A&M | 2–6 | 4–8 | |
 Baylor | 1–7 | 3–9 | |
| Iowa State | 0–8 | 2–10 |
Ordered by conference winning percentage, then conference wins. Division splits and tiebreakers aren’t applied.