
2003 Texas
10–3 (7–1 Big 12), coached by Mack Brown, finished No. 12 in the AP poll. Share
Schedule and results
- Biggest upsetBeat No. 12 Nebraska 31–7Nov 1
Nebraska was ranked No. 12, above it.
| Date | Opponent | Result | Elo |
|---|---|---|---|
| Aug 31 | vs New Mexico State | W 66–7 | 82% |
| Sep 13 | vs Arkansas | L 28–38 | 74% |
| Sep 20 | at Rice | W 48–7 | 75% |
| Sep 27 | vs Tulane | W 63–18 | 75% |
| Oct 4 | vs 16Kansas State | W 24–20 | 62% |
| Oct 11 | vs 1Oklahoma | L 13–65 | 39% |
| Oct 18 | at Iowa State | W 40–19 | 70% |
| Oct 25 | at Baylor | W 56–0 | 82% |
| Nov 1 | vs 12Nebraska | W 31–7 | 66% |
| Nov 8 | at 21Oklahoma State | W 55–16 | 56% |
| Nov 15 | vs Texas Tech | W 43–40 | 75% |
| Nov 28 | at Texas A&M | W 46–15 | 80% |
| Dec 30Bowls & playoff | vs 15Washington StateHoliday Bowl | L 20–28 | 60% |
Elo: a pregame chance from scores alone.
How it ended: Lost to Washington State 28–20 in the Holiday Bowl; No. 12 in the final AP poll; 2nd in the Big 12.
In program history: The 21st-best season in program history by end-of-season Elo (of 126 on file).
AP poll, week by week
- Wk 1: 5
- Wk 3: 6
- Wk 4: 6
- Wk 5: 13
- Wk 6: 14
- Wk 7: 13
- Wk 8: 11
- Wk 9: 20
- Wk 10: 19
- Wk 11: 16
- Wk 12: 11
- Wk 13: 6
- Wk 14: 7
- Wk 15: 6
- Wk 16: 6
- Final: 12
Players on this team
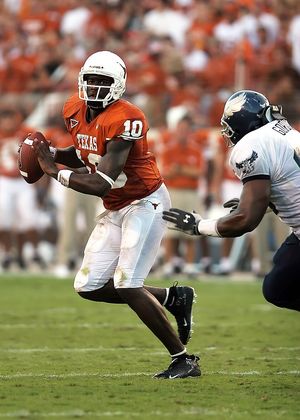 Vince YoungQuarterback
 Derrick JohnsonLinebacker
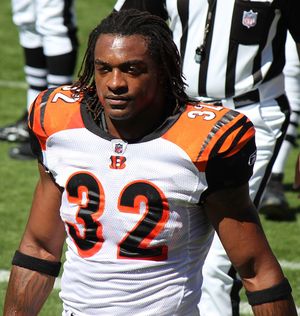 Cedric BensonRunning back
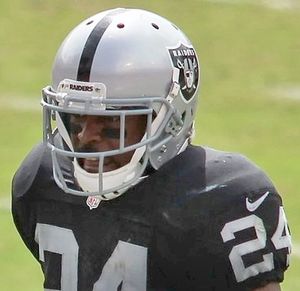 Michael HuffDefensive back
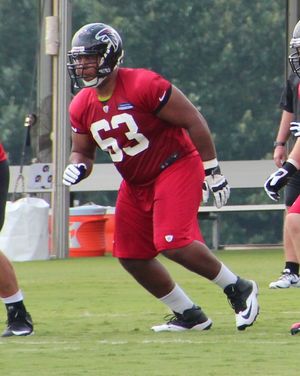 Justin BlalockGuard
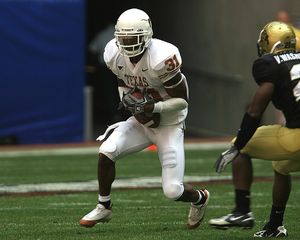 Aaron RossCornerback
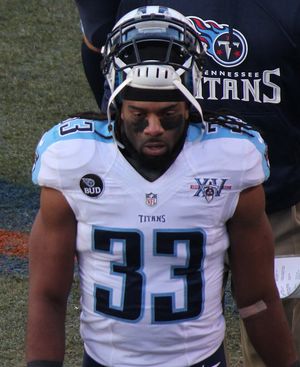 Michael GriffinDefensive back
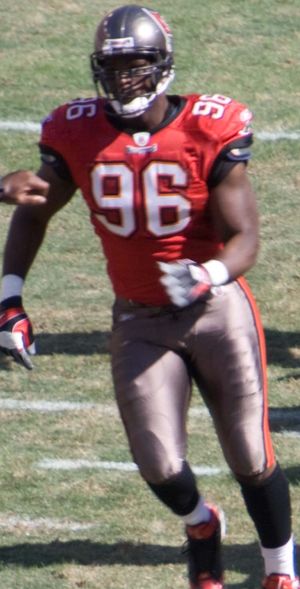 Tim CrowderDefensive end
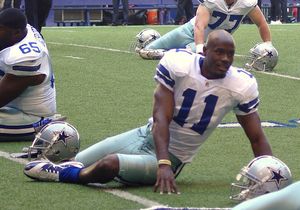 Roy WilliamsReceiver
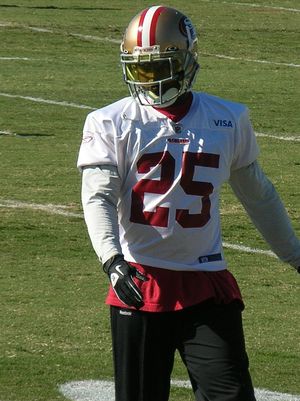 Tarell BrownDefensive back
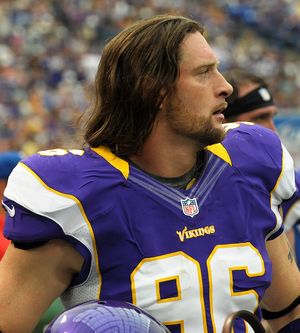 Brian RobisonDefensive end
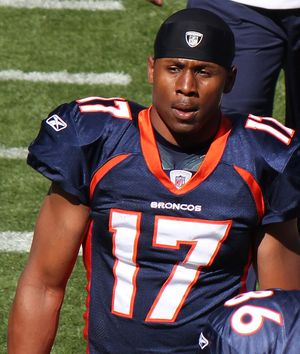 Quan CosbyReceiver
Before 2004 our records hold honors and the draft; these are the players whose college years here, from their Wikipedia articles or their honors, include 2003.
Led the nationCedric Benson: rushing touchdowns (21 TD), points (134 pts); Vince Young: yards per carry (7.4)
- Record
- 10–3
- Conference
- 7–1 2nd in Big 12
- AP final
- No. 12 peak No. 5
- Points
- 533–280
- Coach
- Mack Brown
- Elo
- 1740 +68 this season
- SP+ rating
- 22.7 No. 9 of 117; offense No. 4, defense No. 43
- SRS
- 15.0 No. 10 of 117 in Division I-A
- Recruiting class
- No. 8
- Offensive coordinator
- Greg Davis
- Defensive coordinator
- Carl Reese
- Offense
- Spread
Drives and havoc
| Points per trip inside the 40 | Average start | Havoc | |
|---|---|---|---|
| Offense | -0.2 | own 36 | — allowed |
| Defense | -0.0 | own 30 | — caused |
A trip inside the 40 is a drive that reaches the opponent’s 40-yard line; points per trip is how many it scored on average (allowed, on defense). Average start is where drives began (the defense’s line is where its opponents started). Havoc is the share of plays ending in a tackle for loss, a forced fumble, an interception or a pass broken up. From CollegeFootballData.com.
Top recruits in the 2003 class
| Tony Hills TE | ★★★★★ | No. 30 |
| Tarell Brown CB | ★★★★ | No. 41 |
| Tim Crowder WDE | ★★★★ | No. 50 |
| Erik Hardeman RB | ★★★★ | No. 108 |
| Michael Griffin S | ★★★★ | No. 129 |
247Sports composite rankings via CollegeFootballData.com; national rank in the class.
The 2003 class by position
| Signed | Stars | Rating | |
|---|---|---|---|
| Running backs | 1 | 4.0 | 0.935 |
| Receivers | 1 | 5.0 | 0.984 |
| Defensive line | 1 | 4.0 | 0.976 |
| Defensive backs | 2 | 4.0 | 0.943 |
| Whole class | 5 | 4.2 | 0.956 |
High-school signees by position group, with their average stars and 247Sports composite rating (out of 1), via CollegeFootballData.com. Athletes are signees with no set position.
Drafted in 2004
The 2004 draft| Rd 1 | Roy Williams WR | Detroit Lions |
| Rd 1 | Marcus Tubbs DT | Seattle Seahawks |
| Rd 4 | Nathan Vasher DB | Chicago Bears |
| Rd 7 | Sloan Thomas WR | Houston Texans |
All-Big 12
4 first team, 3 second teamFirst team
 Tillman HollowayOGCoaches-1; Media-1
- Marcus TubbsDLCoaches-1; Media-2
- Derrick JohnsonLBCoaches-1; Media-1
- Nathan VasherDBCoaches-1; Media-1
Second team
- Cedric BensonRBCoaches-2; Media-2
- Roy WilliamsWRCoaches-2; Media-2
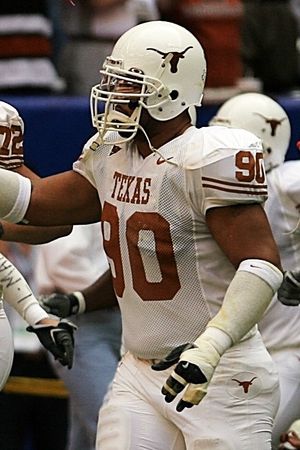 Rodrique WrightDLMedia-2
From Wikipedia’s 2003 all-conference team article, with the selectors that named each player (AP-1: the Associated Press’s first team).
2003 Big 12 standings
| Team | Conf. | Overall | AP final |
|---|---|---|---|
| Oklahoma | 8–0 | 12–2 | 3 |
| Texas | 7–1 | 10–3 | 12 |
| Kansas State | 6–2 | 11–4 | 14 |
| Nebraska | 5–3 | 10–3 | 19 |
| Oklahoma State | 5–3 | 9–4 | |
 Missouri | 4–4 | 8–5 | |
| Texas Tech | 4–4 | 8–5 | |
 Kansas | 3–5 | 6–7 | |
 Colorado | 3–5 | 5–7 | |
| Texas A&M | 2–6 | 4–8 | |
| Baylor | 1–7 | 3–9 | |
| Iowa State | 0–8 | 2–10 |
Ordered by conference winning percentage, then conference wins. Division splits and tiebreakers aren’t applied.