
2019 LSU
15–0 (8–0 Southeastern Conference), coached by Ed Orgeron, finished No. 1 in the AP poll. Share
Schedule and results
- Biggest upsetBeat No. 2 Alabama 46–41Nov 9
Alabama was ranked No. 2 and favored to win.
- Most excitingBeat No. 9 Auburn 23–20Oct 26
The win probability swung the most, by CollegeFootballData.com’s excitement index.
| Date | Opponent | Result | Elo |
|---|---|---|---|
| Aug 31 | vs Georgia Southern | W 55–3 | 74% |
| Sep 7 | at 9Texas | W 45–38 | 46% |
| Sep 14 | vs Northwestern State | W 65–14 | 96% |
| Sep 21 | at Vanderbilt | W 66–38 | 74% |
| Oct 5 | vs Utah State | W 42–6 | 69% |
| Oct 12 | vs 7Florida | W 42–28 | 62% |
| Oct 19 | at Mississippi State | W 36–13 | 68% |
| Oct 26 | vs 9Auburn | W 23–20 | 69% |
| Nov 9 | at 2Alabama | W 46–41 | 35% |
| Nov 16 | at Ole Miss | W 58–37 | 83% |
| Nov 23 | vs Arkansas | W 56–20 | 96% |
| Nov 30 | vs Texas A&M | W 50–7 | 79% |
| Dec 7 | vs 4GeorgiaSEC Championship Game | W 37–10 | 54% |
| Dec 28Bowls & playoff | vs 4OklahomaPeach Bowl, CFP Semifinal | W 63–28 | 59% |
| Jan 13Bowls & playoff | vs 3ClemsonCFP National Championship | W 42–25 | 46% |
Elo: a pregame chance from scores alone.
How it ended: Beat Clemson 42–25 in the CFP National Championship; No. 1 in the final AP poll; Southeastern Conference champions.
In program history: The best season in program history by end-of-season Elo (of 123 on file).
AP poll, week by week
- Wk 1: 6
- Wk 2: 6
- Wk 3: 4
- Wk 4: 4
- Wk 5: 4
- Wk 6: 5
- Wk 7: 5
- Wk 8: 2
- Wk 9: 2
- Wk 10: 1
- Wk 11: 1
- Wk 12: 1
- Wk 13: 1
- Wk 14: 1
- Wk 15: 1
- Wk 16: 1
- Final: 1
National championsNo. 1 in the final AP poll, and a title the school claims
Southeastern Conference champions8–0 in the conference, won the SEC Championship Game
Led the nationJoe Burrow: passing yards (5,671 yds), passing touchdowns (60 TD), passer rating (202.0), total offense (6,039 yds), total offense per game (402.6); Justin Jefferson: receptions (111 catches); Ja’Marr Chase: receiving yards (1,780 yds), receiving touchdowns (20 TD)
Heisman TrophyJoe Burrow, QB; also the Maxwell, Walter Camp, Davey O’Brien, Unitas Golden Arm, Manning and Lombardi
Biletnikoff AwardJa’Marr Chase, WR
Jim Thorpe AwardGrant Delpit, S
4 consensus All-AmericansJoe Burrow, QB; Ja’Marr Chase, WR; Grant Delpit, S; Derek Stingley Jr., DB
Eddie Robinson Coach of the YearEd Orgeron, coach; also the Walter Camp Coach and Bear Bryant Award
Broyles AwardJoe Brady, coach
- Record
- 15–0
- Conference
- 8–0 first in Southeastern Conference
- AP final
- No. 1 peak No. 1
- Points
- 726–328
- Coach
- Ed Orgeron
- Elo
- 1921 +269 this season
- SP+ rating
- 33.1 No. 2 of 130; offense No. 1, defense No. 20, special teams No. 12
- SRS
- 29.8 No. 1 of 130 in FBS
- Returning
- 86% of last season’s EPA, No. 9 of 130
- Recruiting class
- No. 5 roster talent No. 5 in FBS
- Offensive coordinator
- Steve Ensminger
- Defensive coordinator
- Dave Aranda
- Offense
- Pro Spread
- Defense
- 3–4
How good, play by play
| EPA per play | Success | Explosiveness | FBS rank | |
|---|---|---|---|---|
| Offense | 0.38 | 55% | 1.27 | 1st of 130 |
| Defense | 0.04 | 37% | 1.32 | 34th of 130 |
| Opponent-adjusted | 0.38 off 0.00 def | 56% off 35% def | — | 1st off 14th def |
How these are measured
Play-weighted averages over games against FBS opponents; raw numbers, not adjusted for the strength of the opponent. EPA (expected points added) measures how much each play changed the expected score; success rate counts plays that kept the offense on schedule; explosiveness is the average EPA on successful plays. Lower is better on defense. Ranked by EPA per play among teams that were FBS that season. The opponent-adjusted row (offense / defense) is CollegeFootballData.com’s WEPA, which accounts for who each team played.
Drives and havoc
| Points per trip inside the 40 | Average start | Havoc | |
|---|---|---|---|
| Offense | 4.7 | own 30 | 16% allowed |
| Defense | 3.1 | own 26 | 23% caused |
CORE rating 38.7, 1st of 130 (offense 28.1, defense -10.7).
A trip inside the 40 is a drive that reaches the opponent’s 40-yard line; points per trip is how many it scored on average (allowed, on defense). Average start is where drives began (the defense’s line is where its opponents started). Havoc is the share of plays ending in a tackle for loss, a forced fumble, an interception or a pass broken up. CORE is CollegeFootballData.com’s context- and opponent-adjusted rating (points better than an average team; lower is better on defense). From CollegeFootballData.com.
Leaders
| Passing yards | Joe Burrow QB | 5,671 yds |
| Passing touchdowns | Joe Burrow QB | 60 TD |
| Rushing yards | Clyde Edwards-Helaire RB | 1,414 yds |
| Rushing touchdowns | Clyde Edwards-Helaire RB | 16 TD |
| Receiving yards | Ja’Marr Chase WR | 1,780 yds |
| Receiving touchdowns | Ja’Marr Chase WR | 20 TD |
| Tackles | Jacob Phillips LB | 113 tkl |
| Sacks | K’Lavon Chaisson LB | 6.5 sacks |
| Interceptions | Derek Stingley Jr. CB | 6 INT |
Top recruits in the 2019 class
| Derek Stingley Jr. CB | ★★★★★ | No. 3 |
| John Emery Jr. RB | ★★★★★ | No. 13 |
| Marcel Brooks OLB | ★★★★★ | No. 32 |
| Kardell Thomas OG | ★★★★ | No. 97 |
| Trey Palmer WR | ★★★★ | No. 112 |
| Maurice Hampton CB | ★★★★ | No. 129 |
| Siaki Ika DT | ★★★★ | No. 138 |
| Tyrion Davis-Price RB | ★★★★ | No. 139 |
247Sports composite rankings via CollegeFootballData.com; national rank in the class.
The 2019 class by position
| Signed | Stars | Rating | |
|---|---|---|---|
| Quarterbacks | 2 | 3.5 | 0.858 |
| Running backs | 4 | 3.3 | 0.875 |
| Receivers | 2 | 3.5 | 0.875 |
| Offensive line | 5 | 3.6 | 0.916 |
| Defensive line | 3 | 3.3 | 0.893 |
| Linebackers | 3 | 4.0 | 0.934 |
| Defensive backs | 4 | 3.8 | 0.926 |
| Athletes and specialists | 4 | 3.3 | 0.862 |
| Whole class | 27 | 3.5 | 0.895 |
High-school signees by position group, with their average stars and 247Sports composite rating (out of 1), via CollegeFootballData.com. Athletes are signees with no set position.
Drafted in 2020
The 2020 draft| Rd 1 | Joe Burrow QB | Cincinnati Bengals |
| Rd 1 | K’Lavon Chaisson OLB | Jacksonville Jaguars |
| Rd 1 | Justin Jefferson WR | Minnesota Vikings |
| Rd 1 | Patrick Queen ILB | Baltimore Ravens |
| Rd 1 | Clyde Edwards-Helaire RB | Kansas City Chiefs |
| Rd 2 | Grant Delpit S | Cleveland Browns |
| Rd 2 | Kristian Fulton CB | Tennessee Titans |
| Rd 3 | Damien Lewis OG | Seattle Seahawks |
| Rd 3 | Lloyd Cushenberry III C | Denver Broncos |
| Rd 3 | Jacob Phillips ILB | Cleveland Browns |
| Rd 4 | Saahdiq Charles OT | Washington Football Team |
| Rd 4 | Rashard Lawrence DT | Arizona Cardinals |
| Rd 6 | Blake Ferguson LS | Miami Dolphins |
| Rd 7 | Stephen Sullivan TE | Seattle Seahawks |
Roster 112
The 2019 roster112 players, with numbers, heights, hometowns and each player’s 2019 line; 60 have a stat line. See the roster
All-SEC
7 first team, 7 second teamFirst team
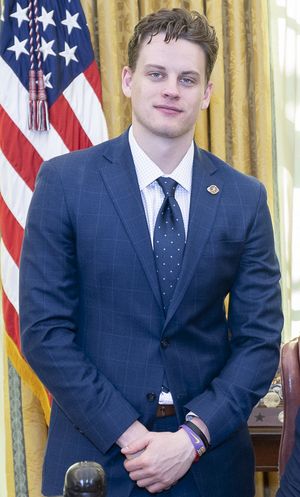 Joe BurrowQBAP-1; Coaches-1
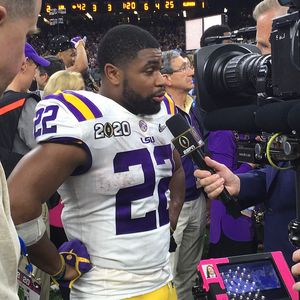 Clyde Edwards-HelaireRBAP-1; Coaches-1
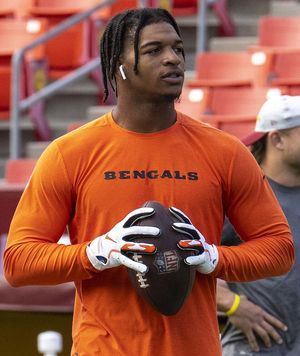 Ja’Marr ChaseWRAP-1; Coaches-1
 Lloyd CushenberryCCoaches-1
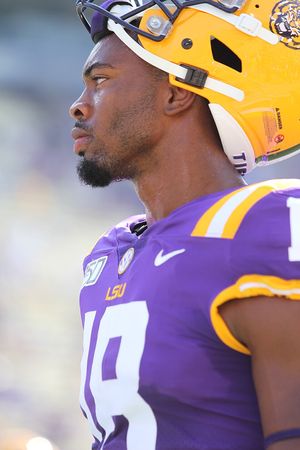 K’Lavon ChaissonLBAP-2; Coaches-1
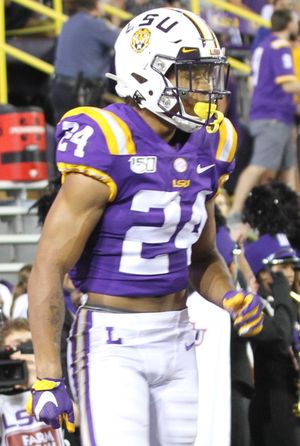 Derek Stingley Jr.CBAP-1; Coaches-2
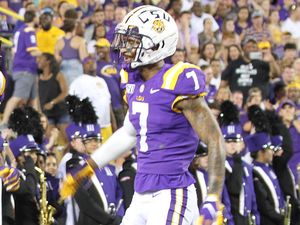 Grant DelpitSAP-2; Coaches-1
Second team
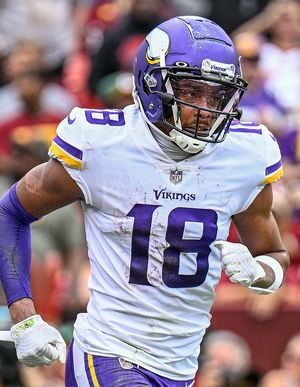 Justin JeffersonWRAP-2
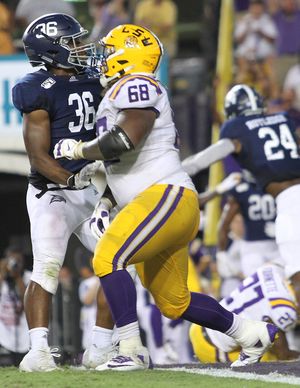 Damien LewisOGAP-2; Coaches-2
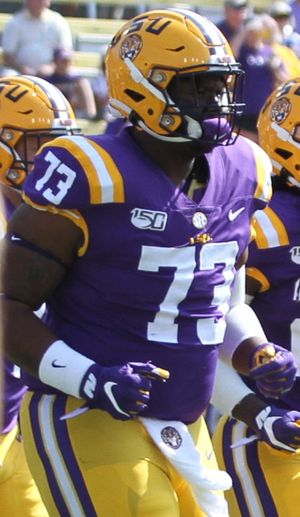 Adrian MageeOTCoaches-2
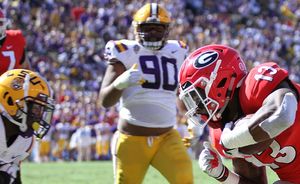 Rashard LawrenceDTCoaches-2
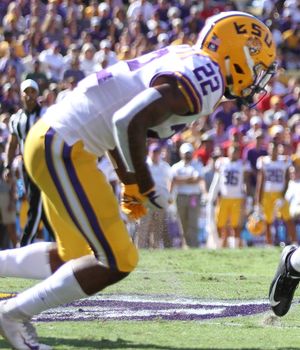 Kristian FultonCBAP-2
- JaCoby StevensSCoaches-2
- Cade YorkKAP-2
From Wikipedia’s 2019 all-conference team article, with the selectors that named each player (AP-1: the Associated Press’s first team).
2019 Southeastern Conference standings
Conference page| Team | Conf. | Overall | AP final |
|---|---|---|---|
| LSU | 8–0 | 15–0 | 1 |
| Georgia | 7–1 | 12–2 | 4 |
| Alabama | 6–2 | 11–2 | 8 |
| Florida | 6–2 | 11–2 | 6 |
| Auburn | 5–3 | 9–4 | 14 |
 Tennessee | 5–3 | 8–5 | |
| Texas A&M | 4–4 | 8–5 | |
 Kentucky | 3–5 | 8–5 | |
 Missouri | 3–5 | 6–6 | |
| Mississippi State | 3–5 | 6–7 | |
 South Carolina | 3–5 | 4–8 | |
| Ole Miss | 2–6 | 4–8 | |
| Vanderbilt | 1–7 | 3–9 | |
| Arkansas | 0–8 | 2–10 |
Ordered by conference winning percentage, then conference wins. Division splits and tiebreakers aren’t applied.