2011 LSU
13–1 (8–0 Southeastern Conference), coached by Les Miles, finished No. 2 in the AP poll. Share
Schedule and results
- Best winBeat No. 2 Alabama 9–6Nov 5
Over the best-ranked team it beat, on the road.
- Biggest upsetBeat No. 3 Oregon 40–27Sep 3
Oregon was ranked No. 3, above it.
| Date | Opponent | Result | Elo |
|---|---|---|---|
| Sep 3 | vs 3Oregon | W 40–27 | 43% |
| Sep 10 | vs Northwestern State | W 49–3 | 95% |
| Sep 15 | at 25Mississippi State | W 19–6 | 55% |
| Sep 24 | at 16West Virginia | W 47–21 | 52% |
| Oct 1 | vs Kentucky | W 35–7 | 86% |
| Oct 8 | vs 17Florida | W 41–11 | 70% |
| Oct 15 | at Tennessee | W 38–7 | 72% |
| Oct 22 | vs 19Auburn | W 45–10 | 71% |
| Nov 5 | at 2Alabama | W 9–6 | 40% |
| Nov 12 | vs Western Kentucky | W 42–9 | 94% |
| Nov 19 | at Ole Miss | W 52–3 | 90% |
| Nov 25 | vs 3Arkansas | W 41–17 | 68% |
| Dec 3 | vs 12GeorgiaSEC Championship Game | W 42–10 | 69% |
| Jan 9Bowls & playoff | vs2AlabamaBCS National Championship | L 0–21 | 54% |
Elo: a pregame chance from scores alone.
How it ended: Lost to Alabama 21–0 in the BCS National Championship; No. 2 in the final AP poll; Southeastern Conference champions.
In program history: The 2nd-best season in program history by end-of-season Elo (of 123 on file).
AP poll, week by week
- Wk 1: 4
- Wk 2: 2
- Wk 3: 3
- Wk 4: 2
- Wk 5: 1
- Wk 6: 1
- Wk 7: 1
- Wk 8: 1
- Wk 9: 1
- Wk 10: 1
- Wk 11: 1
- Wk 12: 1
- Wk 13: 1
- Wk 14: 1
- Wk 15: 1
- Final: 2
Southeastern Conference champions8–0 in the conference, won the SEC Championship Game
Heisman voteTyrann Mathieu, fifth
Jim Thorpe AwardMorris Claiborne, CB
Chuck Bednarik AwardTyrann Mathieu, CB
2 consensus All-AmericansMorris Claiborne, CB; Tyrann Mathieu, CB
Walter Camp Coach of the YearLes Miles, coach
Broyles AwardJohn Chavis, coach
- Record
- 13–1
- Conference
- 8–0 first in Southeastern Conference
- AP final
- No. 2 peak No. 1
- Points
- 500–158
- Coach
- Les Miles
- Elo
- 1835 +187 this season
- SP+ rating
- 31.9 No. 2 of 120; offense No. 18, defense No. 2, special teams No. 3
- SRS
- 25.9 No. 2 of 120 in FBS
- Recruiting class
- No. 8
- Offensive coordinator
- Greg Studrawa
- Defensive coordinator
- John Chavis
- Captains
- Will Blackwell, Morris Claiborne, Jordan Jefferson and Brandon Taylor
- Most valuable player
- Tyrann Mathieu
- Offense
- Multiple
- Defense
- 4–3
How good, play by play
| EPA per play | Success | Explosiveness | FBS rank | |
|---|---|---|---|---|
| Offense | 0.04 | 43% | 0.80 | 63rd of 120 |
| Defense | 0.00 | 34% | 1.11 | 23rd of 120 |
| Opponent-adjusted | 0.07 off 0.01 def | 45% off 35% def | — | 44th off 20th def |
How these are measured
Play-weighted averages over games against FBS opponents; raw numbers, not adjusted for the strength of the opponent. EPA (expected points added) measures how much each play changed the expected score; success rate counts plays that kept the offense on schedule; explosiveness is the average EPA on successful plays. Lower is better on defense. Ranked by EPA per play among teams that were FBS that season. The opponent-adjusted row (offense / defense) is CollegeFootballData.com’s WEPA, which accounts for who each team played.
Drives and havoc
| Points per trip inside the 40 | Average start | Havoc | |
|---|---|---|---|
| Offense | -0.1 | own 33 | 2% allowed |
| Defense | -0.7 | own 27 | 3% caused |
A trip inside the 40 is a drive that reaches the opponent’s 40-yard line; points per trip is how many it scored on average (allowed, on defense). Average start is where drives began (the defense’s line is where its opponents started). Havoc is the share of plays ending in a tackle for loss, a forced fumble, an interception or a pass broken up. From CollegeFootballData.com.
Leaders
| Passing yards | Jarrett Lee QB | 1,306 yds |
| Passing touchdowns | Jarrett Lee QB | 14 TD |
| Rushing yards | Michael Ford RB | 756 yds |
| Rushing touchdowns | Kenny Hilliard RB | 8 TD |
| Receiving yards | Rueben Randle WR | 917 yds |
| Receiving touchdowns | Rueben Randle WR | 8 TD |
| Interceptions | Morris Claiborne CB | 6 INT |
Top recruits in the 2011 class
| La’el Collins OT | ★★★★★ | No. 3 |
| Anthony Johnson DT | ★★★★★ | No. 5 |
| Jarvis Landry WR | ★★★★★ | No. 15 |
| Jermauria Rasco WDE | ★★★★ | No. 90 |
| Kenny Hilliard RB | ★★★★ | No. 116 |
| Odell Beckham Jr. WR | ★★★★ | No. 134 |
| David Jenkins CB | ★★★★ | No. 155 |
| Mickey Johnson DT | ★★★★ | No. 158 |
247Sports composite rankings via CollegeFootballData.com; national rank in the class.
The 2011 class by position
| Signed | Stars | Rating | |
|---|---|---|---|
| Quarterbacks | 1 | 4.0 | 0.918 |
| Running backs | 1 | 4.0 | 0.943 |
| Receivers | 2 | 4.5 | 0.965 |
| Offensive line | 4 | 3.5 | 0.907 |
| Defensive line | 3 | 4.3 | 0.962 |
| Linebackers | 1 | 4.0 | 0.903 |
| Defensive backs | 2 | 3.5 | 0.905 |
| Athletes and specialists | 2 | 3.0 | 0.837 |
| Whole class | 16 | 3.8 | 0.918 |
High-school signees by position group, with their average stars and 247Sports composite rating (out of 1), via CollegeFootballData.com. Athletes are signees with no set position.
Drafted in 2012
The 2012 draft| Rd 1 | Morris Claiborne CB | Dallas Cowboys |
| Rd 1 | Michael Brockers DT | St. Louis Rams |
| Rd 2 | Rueben Randle WR | New York Giants |
| Rd 3 | Brandon Taylor S | San Diego Chargers |
| Rd 4 | Ron Brooks CB | Buffalo Bills |
Roster 122
The 2011 roster122 players, with numbers, heights, hometowns and each player’s 2011 line; 32 have a stat line. See the roster
All-SEC
7 first team, 7 second teamFirst team
 Rueben RandleWRAP-2; Coaches-1
- Will BlackwellOGAP-1; Coaches-1
- Alex HurstOTCoaches-1
- Sam MontgomeryDEAP-1; Coaches-1
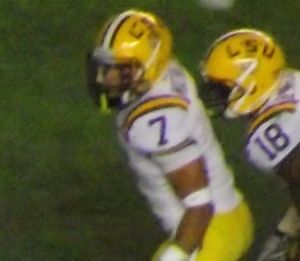 Tyrann MathieuCBAP-1; Coaches-1
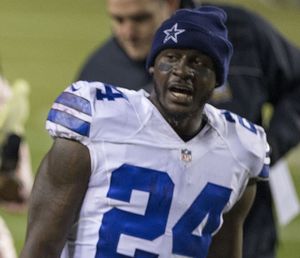 Morris ClaiborneCBAP-1; Coaches-1
- Brad WingPAP-1; Coaches-2
Second team
- Spencer WareRBCoaches-2
- Chris FaulkOTAP-2
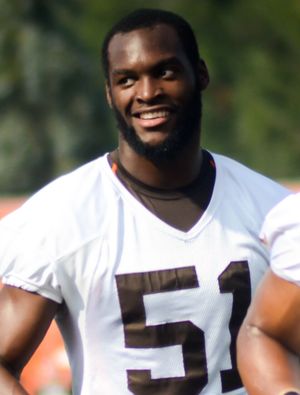 Barkevious MingoDEAP-2
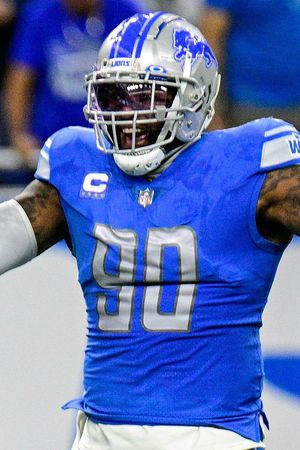 Michael BrockersDTAP-2
- Ryan BakerLBCoaches-2
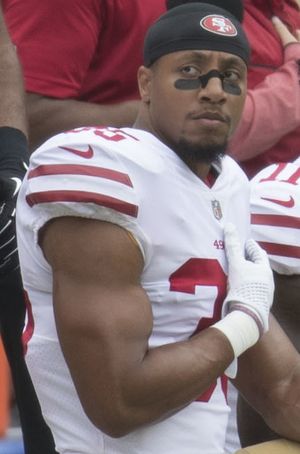 Eric ReidSAP-2
- Drew AllemanKAP-2; Coaches-2
From Wikipedia’s 2011 all-conference team article, with the selectors that named each player (AP-1: the Associated Press’s first team).
2011 Southeastern Conference standings
Conference page| Team | Conf. | Overall | AP final |
|---|---|---|---|
| LSU | 8–0 | 13–1 | 2 |
| Alabama | 7–1 | 12–1 | 1 |
| Georgia | 7–1 | 10–4 | 19 |
| Arkansas | 6–2 | 11–2 | 5 |
 South Carolina | 6–2 | 11–2 | 9 |
| Auburn | 4–4 | 8–5 | |
| Florida | 3–5 | 7–6 | |
| Mississippi State | 2–6 | 7–6 | |
 Vanderbilt | 2–6 | 6–7 | |
| Kentucky | 2–6 | 5–7 | |
| Tennessee | 1–7 | 5–7 | |
| Ole Miss | 0–8 | 2–10 |
Ordered by conference winning percentage, then conference wins. Division splits and tiebreakers aren’t applied.