2010 Auburn
14–0 (8–0 Southeastern Conference), coached by Gene Chizik, finished No. 1 in the AP poll. Share
Schedule and results
- Best winBeat No. 2 Oregon 22–19Jan 10
Over the best-ranked team it beat, at a neutral site.
- Biggest upsetBeat No. 12 South Carolina 35–27Sep 25
South Carolina was ranked No. 12, above it.
| Date | Opponent | Result | Elo |
|---|---|---|---|
| Sep 4 | vs Arkansas State | W 52–26 | 74% |
| Sep 9 | at Mississippi State | W 17–14 | 47% |
| Sep 18 | vs Clemson | W 27–24 | 55% |
| Sep 25 | vs 12South Carolina | W 35–27 | 58% |
| Oct 2 | vs UL Monroe | W 52–3 | 82% |
| Oct 9 | at Kentucky | W 37–34 | 54% |
| Oct 16 | vs 12Arkansas | W 65–43 | 58% |
| Oct 23 | vs 6LSU | W 24–17 | 51% |
| Oct 30 | at Ole Miss | W 51–31 | 60% |
| Nov 6 | vs Chattanooga | W 62–24 | 91% |
| Nov 13 | vs Georgia | W 49–31 | 72% |
| Nov 26 | at 9Alabama | W 28–27 | 33% |
| Dec 4 | vs18South CarolinaSEC Championship Game | W 56–17 | 56% |
| Jan 10Bowls & playoff | vs 2OregonBCS National Championship | W 22–19 | 43% |
Elo: a pregame chance from scores alone.
How it ended: Beat Oregon 22–19 in the BCS National Championship; No. 1 in the final AP poll; Southeastern Conference champions.
In program history: The 2nd-best season in program history by end-of-season Elo (of 124 on file).
AP poll, week by week
- Wk 1: 22
- Wk 2: 21
- Wk 3: 16
- Wk 4: 17
- Wk 5: 10
- Wk 6: 8
- Wk 7: 7
- Wk 8: 5
- Wk 9: 3
- Wk 10: 3
- Wk 11: 2
- Wk 12: 2
- Wk 13: 2
- Wk 14: 2
- Wk 15: 1
- Final: 1
National championsNo. 1 in the final AP poll, and a title the school claims
Southeastern Conference champions8–0 in the conference, won the SEC Championship Game
Led the nationOnterio McCalebb: yards per carry (8.5)
Heisman TrophyCam Newton, QB; also the Maxwell, Walter Camp, Davey O’Brien and Manning
Lombardi AwardNick Fairley, DT
3 consensus All-AmericansCam Newton, QB; Lee Ziemba, OT; Nick Fairley, DT
Paul “Bear” Bryant AwardGene Chizik, coach
Broyles AwardGus Malzahn, coach
- Record
- 14–0
- Conference
- 8–0 first in Southeastern Conference
- AP final
- No. 1 peak No. 1
- Points
- 577–337
- Coach
- Gene Chizik
- Elo
- 1782 +235 this season
- SP+ rating
- 26.5 No. 6 of 120; offense No. 1, defense No. 44, special teams No. 68
- SRS
- 20.4 No. 6 of 120 in FBS
- Recruiting class
- No. 6
- Offensive coordinator
- Gus Malzahn
- Defensive coordinator
- Ted Roof
- Captains
- Kodi Burns, Josh Bynes, Zac Etheridge and Lee Ziemba
- Offense
- Spread option, Play Action / Read
- Defense
- 4–3, Tampa 2
How good, play by play
| EPA per play | Success | Explosiveness | FBS rank | |
|---|---|---|---|---|
| Offense | 0.16 | 50% | 0.89 | 3rd of 120 |
| Defense | 0.04 | 43% | 0.93 | 51st of 120 |
| Opponent-adjusted | 0.14 off 0.02 def | 51% off 41% def | — | 2nd off 35th def |
How these are measured
Play-weighted averages over games against FBS opponents; raw numbers, not adjusted for the strength of the opponent. EPA (expected points added) measures how much each play changed the expected score; success rate counts plays that kept the offense on schedule; explosiveness is the average EPA on successful plays. Lower is better on defense. Ranked by EPA per play among teams that were FBS that season. The opponent-adjusted row (offense / defense) is CollegeFootballData.com’s WEPA, which accounts for who each team played.
Drives and havoc
| Points per trip inside the 40 | Average start | Havoc | |
|---|---|---|---|
| Offense | 0.1 | own 30 | 2% allowed |
| Defense | -0.2 | own 28 | 2% caused |
A trip inside the 40 is a drive that reaches the opponent’s 40-yard line; points per trip is how many it scored on average (allowed, on defense). Average start is where drives began (the defense’s line is where its opponents started). Havoc is the share of plays ending in a tackle for loss, a forced fumble, an interception or a pass broken up. From CollegeFootballData.com.
Player leaders are hidden for this season: our source’s player stats for Auburn are missing players (they add up to less than 85% of the team’s passing or rushing yards).
Top recruits in the 2010 class
| Michael Dyer RB | ★★★★★ | No. 8 |
| Trovon Reed ATH | ★★★★★ | No. 25 |
| Corey Lemonier WDE | ★★★★ | No. 53 |
| Shon Coleman OT | ★★★★ | No. 94 |
| Jeffrey Whitaker DT | ★★★★ | No. 106 |
| LaDarius Owens WDE | ★★★★ | No. 153 |
| Antonio Goodwin WR | ★★★★ | No. 155 |
| Eric Mack OG | ★★★★ | No. 190 |
247Sports composite rankings via CollegeFootballData.com; national rank in the class.
The 2010 class by position
| Signed | Stars | Rating | |
|---|---|---|---|
| Running backs | 2 | 3.5 | 0.881 |
| Receivers | 3 | 4.0 | 0.916 |
| Offensive line | 5 | 3.2 | 0.881 |
| Defensive line | 6 | 3.8 | 0.914 |
| Linebackers | 3 | 3.3 | 0.881 |
| Defensive backs | 3 | 3.0 | 0.853 |
| Athletes and specialists | 2 | 4.0 | 0.914 |
| Whole class | 24 | 3.5 | 0.893 |
High-school signees by position group, with their average stars and 247Sports composite rating (out of 1), via CollegeFootballData.com. Athletes are signees with no set position.
Drafted in 2011
The 2011 draft| Rd 1 | Cam Newton QB | Carolina Panthers |
| Rd 1 | Nick Fairley DT | Detroit Lions |
| Rd 7 | Zach Clayton DT | Tennessee Titans |
| Rd 7 | Lee Ziemba OT | Carolina Panthers |
Roster 116
The 2010 roster116 players, with numbers, heights, hometowns and each player’s 2010 line; 33 have a stat line. See the roster
All-SEC
4 first team, 3 second teamFirst team
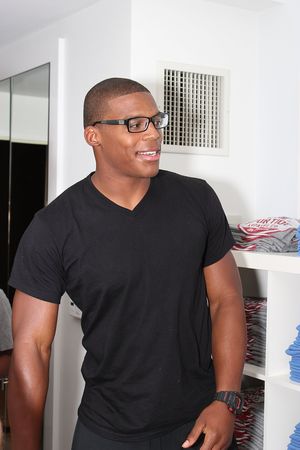 Cam NewtonQBAP-1; Coaches-1
 Ryan PughCAP-1; Coaches-1
- Lee ZiembaOTAP-1; Coaches-1
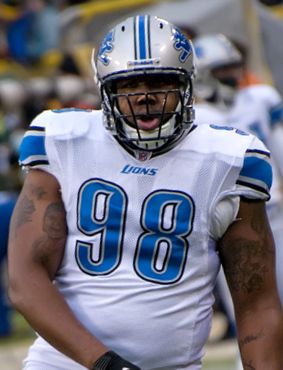 Nick FairleyDTAP-1; Coaches-1
Second team
- Byron IsomOTAP-2
- Antoine CarterDEAP-2
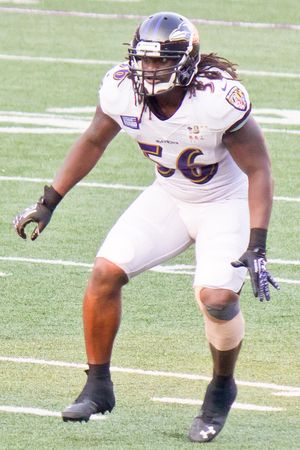 Josh BynesLBAP-2
From Wikipedia’s 2010 all-conference team article, with the selectors that named each player (AP-1: the Associated Press’s first team).
2010 Southeastern Conference standings
Conference page| Team | Conf. | Overall | AP final |
|---|---|---|---|
| Auburn | 8–0 | 14–0 | 1 |
| LSU | 6–2 | 11–2 | 8 |
| Arkansas | 6–2 | 10–3 | 12 |
| Alabama | 5–3 | 10–3 | 10 |
| South Carolina | 5–3 | 9–5 | 22 |
| Mississippi State | 4–4 | 9–4 | 15 |
 Florida | 4–4 | 8–5 | |
| Georgia | 3–5 | 6–7 | |
 Tennessee | 3–5 | 6–7 | |
| Kentucky | 2–6 | 6–7 | |
| Ole Miss | 1–7 | 4–8 | |
 Vanderbilt | 1–7 | 2–10 |
Ordered by conference winning percentage, then conference wins. Division splits and tiebreakers aren’t applied.