2024 Alabama
9–4 (5–3 Southeastern Conference), coached by Kalen DeBoer, finished No. 17 in the AP poll. Share
Schedule and results
- Biggest upsetBeat No. 2 Georgia 41–34Sep 28
Georgia was ranked No. 2 and favored to win.
- Most excitingLost to Vanderbilt 35–40Oct 5
The win probability swung the most, by CollegeFootballData.com’s excitement index.
| Date | Opponent | Result | Elo |
|---|---|---|---|
| Aug 31 | vs Western Kentucky | W 63–0 | 79% |
| Sep 7 | vs South Florida | W 42–16 | 85% |
| Sep 14 | at Wisconsin | W 42–10 | 67% |
| Sep 28 | vs 2Georgia | W 41–34 | 54% |
| Oct 5 | at Vanderbilt | L 35–40 | 85% |
| Oct 12 | vs South Carolina | W 27–25 | 81% |
| Oct 19 | at 11Tennessee | L 17–24 | 52% |
| Oct 26 | vs 21Missouri | W 34–0 | 68% |
| Nov 9 | at 14LSU | W 42–13 | 52% |
| Nov 16 | vs Mercer | W 52–7 | 89% |
| Nov 23 | at Oklahoma | L 3–24 | 74% |
| Nov 30 | vs Auburn | W 28–14 | 84% |
| Dec 31Bowls & playoff | vs MichiganReliaQuest Bowl | L 13–19 | 57% |
Elo: a pregame chance from scores alone.
How it ended: Lost to Michigan 19–13 in the ReliaQuest Bowl; No. 17 in the final AP poll; tied for 4th in the Southeastern Conference.
In program history: The 44th-best season in program history by end-of-season Elo (of 123 on file).
AP poll, week by week
- Wk 1: 5
- Wk 2: 4
- Wk 3: 4
- Wk 4: 4
- Wk 5: 4
- Wk 6: 1
- Wk 7: 7
- Wk 8: 7
- Wk 9: 15
- Wk 10: 14
- Wk 11: 11
- Wk 12: 9
- Wk 13: 7
- Wk 14: 13
- Wk 15: 11
- Wk 16: 11
- Final: 17
- Record
- 9–4
- Conference
- 5–3 tied for 4th in Southeastern Conference
- AP final
- No. 17 peak No. 1
- Points
- 439–226
- Coach
- Kalen DeBoer
- Elo
- 1718 +9 this season
- SP+ rating
- 25.0 No. 4 of 134; offense No. 6, defense No. 8, special teams No. 15
- SRS
- 18.1 No. 6 of 134 in FBS
- Returning
- 60% of last season’s EPA, No. 39 of 133
- Recruiting class
- No. 2 roster talent No. 1 in FBS
- Offensive coordinators
- Nick Sheridan and JaMarcus Shephard
- Defensive coordinators
- Kane Wommack, Maurice Linguist and Colin Hitschler
- Captains
- Tyler Booker, Deontae Lawson, Jalen Milroe and Malachi Moore
- Offense
- Spread
- Defense
- 4–2–5, Swarm
How good, play by play
| EPA per play | Success | Explosiveness | FBS rank | |
|---|---|---|---|---|
| Offense | 0.16 | 45% | 1.27 | 37th of 134 |
| Defense | -0.03 | 36% | 1.19 | 10th of 134 |
| Opponent-adjusted | 0.19 off -0.02 def | 47% off 36% def | — | 28th off 11th def |
How these are measured
Play-weighted averages over games against FBS opponents; raw numbers, not adjusted for the strength of the opponent. EPA (expected points added) measures how much each play changed the expected score; success rate counts plays that kept the offense on schedule; explosiveness is the average EPA on successful plays. Lower is better on defense. Ranked by EPA per play among teams that were FBS that season. The opponent-adjusted row (offense / defense) is CollegeFootballData.com’s WEPA, which accounts for who each team played.
Drives and havoc
| Points per trip inside the 40 | Average start | Havoc | |
|---|---|---|---|
| Offense | 4.7 | own 30 | 16% allowed |
| Defense | 2.9 | own 29 | 18% caused |
CORE rating 14.0, 22nd of 134 (offense 4.9, defense -9.1).
A trip inside the 40 is a drive that reaches the opponent’s 40-yard line; points per trip is how many it scored on average (allowed, on defense). Average start is where drives began (the defense’s line is where its opponents started). Havoc is the share of plays ending in a tackle for loss, a forced fumble, an interception or a pass broken up. CORE is CollegeFootballData.com’s context- and opponent-adjusted rating (points better than an average team; lower is better on defense). From CollegeFootballData.com.
Leaders
| Passing yards | Jalen Milroe QB | 2,844 yds |
| Passing touchdowns | Jalen Milroe QB | 16 TD |
| Rushing yards | Jalen Milroe QB | 726 yds |
| Rushing touchdowns | Jalen Milroe QB | 20 TD |
| Receiving yards | Ryan Williams WR | 865 yds |
| Receiving touchdowns | Ryan Williams WR | 8 TD |
| Tackles | Jihaad Campbell LB | 119 tkl |
| Sacks | Jihaad Campbell LB | 5 sacks |
| Interceptions | Brayson Hubbard DB | 3 INT |
Top recruits in the 2024 class
| Ryan Coleman-Williams WR | ★★★★★ | No. 4 |
| Julian Sayin QB | ★★★★★ | No. 6 |
| Jaylen Mbakwe CB | ★★★★★ | No. 12 |
| Zavier Mincey CB | ★★★★★ | No. 27 |
| Zabien Brown CB | ★★★★★ | No. 30 |
| Caleb Odom TE | ★★★★ | No. 53 |
| Casey Poe OL | ★★★★ | No. 76 |
| Kevin Riley RB | ★★★★ | No. 75 |
247Sports composite rankings via CollegeFootballData.com; national rank in the class.
The 2024 class by position
| Signed | Stars | Rating | |
|---|---|---|---|
| Quarterbacks | 1 | 5.0 | 0.997 |
| Running backs | 2 | 4.0 | 0.948 |
| Receivers | 5 | 4.0 | 0.934 |
| Offensive line | 3 | 3.7 | 0.917 |
| Defensive line | 6 | 3.8 | 0.924 |
| Linebackers | 3 | 3.3 | 0.890 |
| Defensive backs | 7 | 4.3 | 0.946 |
| Athletes and specialists | 1 | 4.0 | 0.917 |
| Whole class | 28 | 4.0 | 0.931 |
High-school signees by position group, with their average stars and 247Sports composite rating (out of 1), via CollegeFootballData.com. Athletes are signees with no set position.
Drafted in 2025
The 2025 draft| Rd 1 | Tyler Booker OG | Dallas Cowboys |
| Rd 1 | Jihaad Campbell LB | Philadelphia Eagles |
| Rd 3 | Jalen Milroe QB | Seattle Seahawks |
| Rd 4 | Malachi Moore S | New York Jets |
| Rd 4 | Que Robinson DE | Denver Broncos |
| Rd 5 | Robbie Ouzts TE | Seattle Seahawks |
| Rd 6 | Tim Smith DT | Indianapolis Colts |
Roster 133
The 2024 roster133 players, with numbers, heights, hometowns and each player’s 2024 line; 73 have a stat line. See the roster
Transfers in 14
The 2024 portal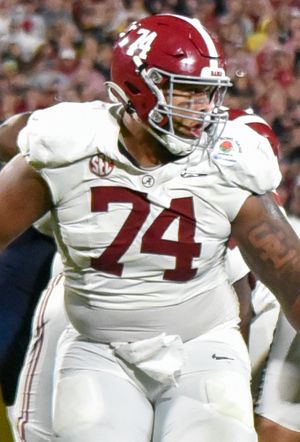 Kadyn Proctor OT | ★★★★★ | from  Iowa |
 L.T. Overton DL | ★★★★ | from  Texas A&M |
 Parker Brailsford OL | ★★★★ | from  Washington |
| Austin Mack QB | ★★★★ | from Washington |
 Domani Jackson CB | ★★★★ | from  USC |
| Keon Sabb S | ★★★★ | from  Michigan |
 King Mack S | ★★★★ | from  Penn State |
| Germie Bernard WR | ★★★★ | from Washington |
| Josh Cuevas TE | ★★★ | from Washington |
| Naquil Betrand OT | ★★★ | from Texas A&M |
 Dashawn Jones CB | ★★★ | from  Wake Forest |
 Kameron Howard S | ★★★ | from  Charlotte |
And 2 more, lower-rated or unrated.
Transfers out 38
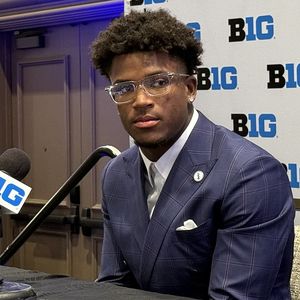 Caleb Downs S | ★★★★★ | to  Ohio State |
 Isaiah Bond WR | ★★★★★ | to  Texas |
 Julian Sayin QB | ★★★★★ | to Ohio State |
| Dezz Ricks CB | ★★★★ | to Texas A&M |
| Amari Niblack TE | ★★★★ | to Texas |
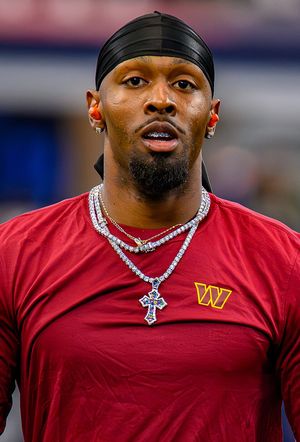 Trey Amos CB | ★★★★ | to  Ole Miss |
| Ja’Corey Brooks WR | ★★★★ | to  Louisville |
| Jameer Grimsley CB | ★★★★ | to  Florida |
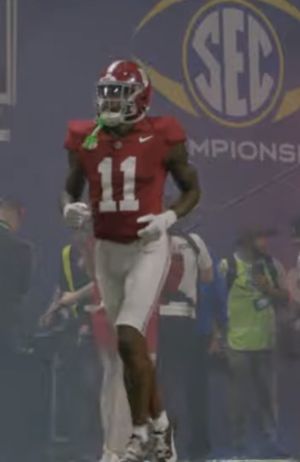 Malik Benson WR | ★★★★ | to  Florida State |
| Roydell Williams RB | ★★★★ | to Florida State |
| Shawn Murphy LB | ★★★★ | to Florida State |
| Earl Little II CB | ★★★★ | to Florida State |
And 26 more, lower-rated or unrated.
All-SEC
4 first team, 1 second teamFirst team
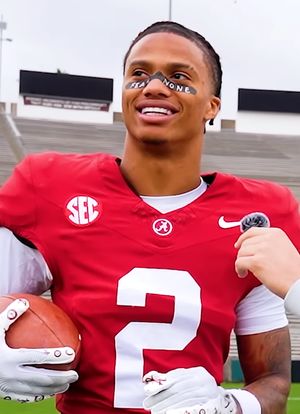 Ryan Coleman-WilliamsWRAP-2; Coaches-1
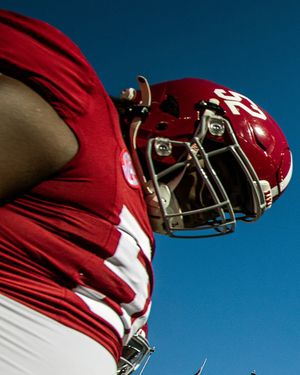 Tyler BookerOLAP-1; Coaches-1
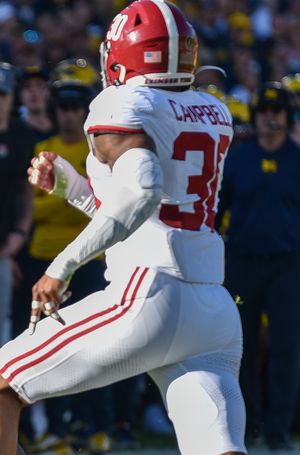 Jihaad CampbellLBAP-2; Coaches-1
- Malachi MooreDBAP-2; Coaches-1
Second team
- Kadyn ProctorOLCoaches-2
From Wikipedia’s 2024 all-conference team article, with the selectors that named each player (AP-1: the Associated Press’s first team).
2024 Southeastern Conference standings
Conference page| Team | Conf. | Overall | AP final |
|---|---|---|---|
 Texas | 7–1 | 13–3 | 4 |
| Georgia | 6–2 | 11–3 | 6 |
| Tennessee | 6–2 | 10–3 | 9 |
| Missouri | 5–3 | 10–3 | 22 |
 Ole Miss | 5–3 | 10–3 | 11 |
| South Carolina | 5–3 | 9–4 | 19 |
| Alabama | 5–3 | 9–4 | 17 |
| LSU | 5–3 | 9–4 | |
| Texas A&M | 5–3 | 8–5 | |
 Florida | 4–4 | 8–5 | |
| Vanderbilt | 3–5 | 7–6 | |
 Arkansas | 3–5 | 7–6 | |
| Oklahoma | 2–6 | 6–7 | |
| Auburn | 2–6 | 5–7 | |
 Kentucky | 1–7 | 4–8 | |
 Mississippi State | 0–8 | 2–10 |
Ordered by conference winning percentage, then conference wins. Division splits and tiebreakers aren’t applied.