2018 Alabama
14–1 (8–0 Southeastern Conference), coached by Nick Saban, finished No. 2 in the AP poll. Share
Schedule and results
- Best winBeat No. 4 LSU 29–0Nov 3
Over the best-ranked team it beat, on the road.
- Most excitingBeat No. 4 Georgia 35–28Dec 1
The win probability swung the most, by CollegeFootballData.com’s excitement index.
| Date | Opponent | Result | Elo |
|---|---|---|---|
| Sep 1 | vs Louisville | W 51–14 | 74% |
| Sep 8 | vs Arkansas State | W 57–7 | 85% |
| Sep 15 | at Ole Miss | W 62–7 | 73% |
| Sep 22 | vs 22Texas A&M | W 45–23 | 85% |
| Sep 29 | vs Louisiana | W 56–14 | 93% |
| Oct 6 | at Arkansas | W 65–31 | 89% |
| Oct 13 | vs Missouri | W 39–10 | 87% |
| Oct 20 | at Tennessee | W 58–21 | 86% |
| Nov 3 | at 4LSU | W 29–0 | 58% |
| Nov 10 | vs 18Mississippi State | W 24–0 | 83% |
| Nov 17 | vs The Citadel | W 50–17 | 97% |
| Nov 24 | vs Auburn | W 52–21 | 84% |
| Dec 1 | vs 4GeorgiaSEC Championship Game | W 35–28 | 62% |
| Dec 29Bowls & playoff | vs 4OklahomaOrange Bowl, CFP Semifinal | W 45–34 | 64% |
| Jan 7Bowls & playoff | vs 2ClemsonCFP National Championship | L 16–44 | 54% |
Elo: a pregame chance from scores alone.
How it ended: Lost to Clemson 44–16 in the CFP National Championship; No. 2 in the final AP poll; Southeastern Conference champions.
In program history: The 5th-best season in program history by end-of-season Elo (of 123 on file).
AP poll, week by week
- Wk 1: 1
- Wk 2: 1
- Wk 3: 1
- Wk 4: 1
- Wk 5: 1
- Wk 6: 1
- Wk 7: 1
- Wk 8: 1
- Wk 9: 1
- Wk 10: 1
- Wk 11: 1
- Wk 12: 1
- Wk 13: 1
- Wk 14: 1
- Wk 15: 1
- Final: 2
Southeastern Conference champions8–0 in the conference, won the SEC Championship Game
Heisman voteTua Tagovailoa, second
Led the nationTua Tagovailoa: passer rating (199.5)
Maxwell AwardTua Tagovailoa, QB; also the Walter Camp
Biletnikoff AwardJerry Jeudy, WR
Outland TrophyQuinnen Williams, DT
5 consensus All-AmericansTua Tagovailoa, QB; Jerry Jeudy, WR; Jonah Williams, OL; Quinnen Williams, DT; Deionte Thompson, DB
Walter Camp Coach of the YearNick Saban, coach
Broyles AwardMike Locksley, coach
- Record
- 14–1
- Conference
- 8–0 first in Southeastern Conference
- AP final
- No. 2 peak No. 1
- Points
- 684–271
- Coach
- Nick Saban
- Elo
- 1890 +128 this season
- SP+ rating
- 36.3 No. 1 of 130; offense No. 2, defense No. 7, special teams No. 80
- SRS
- 27.4 No. 2 of 130 in FBS
- Returning
- 78% of last season’s EPA, No. 35 of 130
- Recruiting class
- No. 5 roster talent No. 2 in FBS
- Offensive coordinators
- Mike Locksley and Josh Gattis
- Defensive coordinators
- Tosh Lupoi and Pete Golding
- Captains
- Damien Harris, Hale Hentges, Christian Miller and Ross Pierschbacher
- Offense
- Pro spread
- Defense
- 3–4
How good, play by play
| EPA per play | Success | Explosiveness | FBS rank | |
|---|---|---|---|---|
| Offense | 0.34 | 54% | 1.25 | 2nd of 130 |
| Defense | 0.00 | 36% | 1.32 | 20th of 130 |
| Opponent-adjusted | 0.33 off -0.05 def | 55% off 33% def | — | 2nd off 5th def |
How these are measured
Play-weighted averages over games against FBS opponents; raw numbers, not adjusted for the strength of the opponent. EPA (expected points added) measures how much each play changed the expected score; success rate counts plays that kept the offense on schedule; explosiveness is the average EPA on successful plays. Lower is better on defense. Ranked by EPA per play among teams that were FBS that season. The opponent-adjusted row (offense / defense) is CollegeFootballData.com’s WEPA, which accounts for who each team played.
Drives and havoc
| Points per trip inside the 40 | Average start | Havoc | |
|---|---|---|---|
| Offense | 4.5 | own 31 | 11% allowed |
| Defense | 2.9 | own 27 | 20% caused |
CORE rating 35.5, 1st of 130 (offense 21.7, defense -13.8).
A trip inside the 40 is a drive that reaches the opponent’s 40-yard line; points per trip is how many it scored on average (allowed, on defense). Average start is where drives began (the defense’s line is where its opponents started). Havoc is the share of plays ending in a tackle for loss, a forced fumble, an interception or a pass broken up. CORE is CollegeFootballData.com’s context- and opponent-adjusted rating (points better than an average team; lower is better on defense). From CollegeFootballData.com.
Leaders
| Passing yards | Tua Tagovailoa QB | 3,966 yds |
| Passing touchdowns | Tua Tagovailoa QB | 43 TD |
| Rushing yards | Damien Harris RB | 876 yds |
| Rushing touchdowns | Josh Jacobs RB | 11 TD |
| Receiving yards | Jerry Jeudy WR | 1,315 yds |
| Receiving touchdowns | Jerry Jeudy WR | 14 TD |
| Tackles | Dylan Moses LB | 86 tkl |
| Sacks | Isaiah Buggs DL | 10 sacks |
| Interceptions | Saivion Smith CB | 3 INT |
Top recruits in the 2018 class
| Eyabi Okie-Anoma WDE | ★★★★★ | No. 4 |
| Patrick Surtain II CB | ★★★★★ | No. 6 |
| Jaylen Waddle WR | ★★★★ | No. 39 |
| Stephon Wynn SDE | ★★★★ | No. 74 |
| Jalyn Armour-Davis CB | ★★★★ | No. 107 |
| Jordan Davis WDE | ★★★★ | No. 108 |
| Josh Jobe CB | ★★★★ | No. 109 |
| Emil Ekiyor OC | ★★★★ | No. 113 |
247Sports composite rankings via CollegeFootballData.com; national rank in the class.
The 2018 class by position
| Signed | Stars | Rating | |
|---|---|---|---|
| Quarterbacks | 2 | 2.5 | 0.777 |
| Running backs | 2 | 3.5 | 0.885 |
| Receivers | 3 | 3.7 | 0.929 |
| Offensive line | 2 | 4.0 | 0.947 |
| Defensive line | 5 | 4.2 | 0.957 |
| Linebackers | 2 | 3.5 | 0.895 |
| Defensive backs | 4 | 4.0 | 0.946 |
| Athletes and specialists | 1 | 3.0 | 0.831 |
| Whole class | 21 | 3.7 | 0.914 |
High-school signees by position group, with their average stars and 247Sports composite rating (out of 1), via CollegeFootballData.com. Athletes are signees with no set position.
Drafted in 2019
The 2019 draft| Rd 1 | Quinnen Williams DT | New York Jets |
| Rd 1 | Jonah Williams OT | Cincinnati Bengals |
| Rd 1 | Josh Jacobs RB | Oakland Raiders |
| Rd 2 | Irv Smith Jr. TE | Minnesota Vikings |
| Rd 3 | Damien Harris RB | New England Patriots |
| Rd 4 | Christian Miller OLB | Carolina Panthers |
| Rd 5 | Deionte Thompson S | Arizona Cardinals |
| Rd 5 | Ross Pierschbacher OG | Washington Redskins |
| Rd 5 | Mack Wilson ILB | Cleveland Browns |
| Rd 6 | Isaiah Buggs DT | Pittsburgh Steelers |
Roster 118
The 2018 roster118 players, with numbers, heights, hometowns and each player’s 2018 line; 55 have a stat line. See the roster
All-SEC
6 first team, 7 second teamFirst team
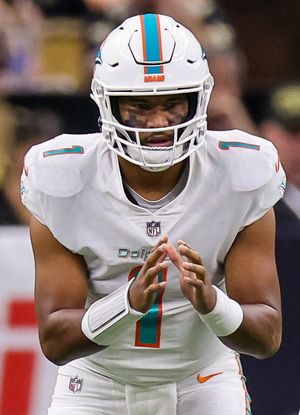 Tua TagovailoaQBAP-1; Coaches-1
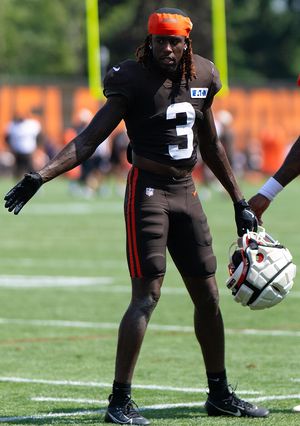 Jerry JeudyWRAP-1; Coaches-1
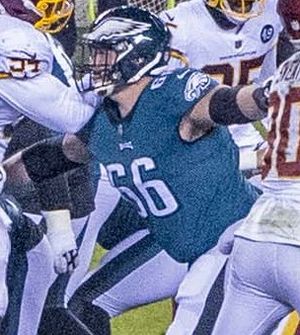 Ross PierschbacherCAP-1; Coaches-2
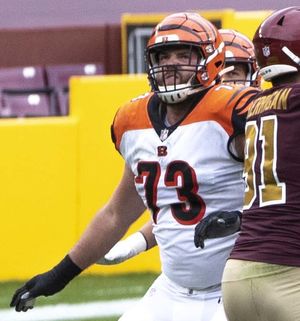 Jonah WilliamsOTAP-1; Coaches-1
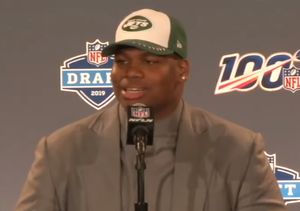 Quinnen WilliamsDTAP-1; Coaches-1
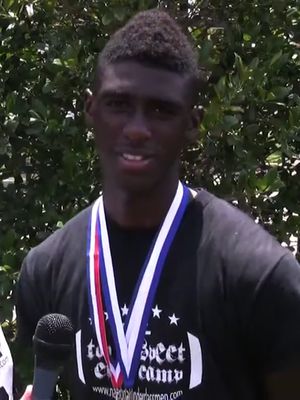 Deionte ThompsonSAP-2; Coaches-1
Second team
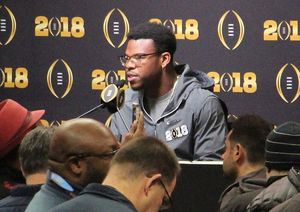 Damien HarrisRBCoaches-2
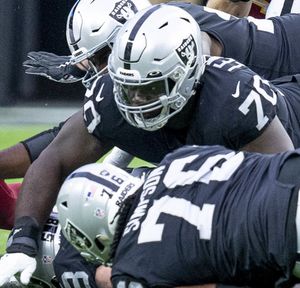 Alex LeatherwoodOTCoaches-2
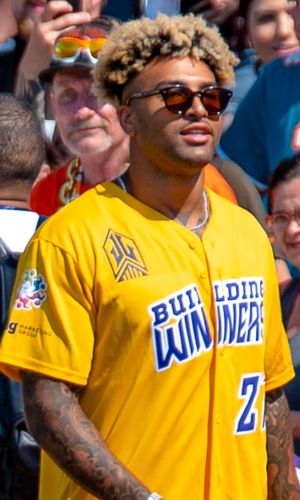 Irv Smith Jr.TEAP-2
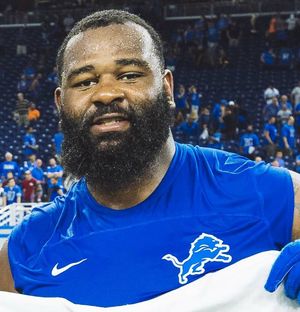 Isaiah BuggsDEAP-2; Coaches-2
 Raekwon DavisDEAP-2
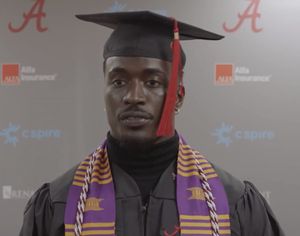 Dylan MosesLBCoaches-2
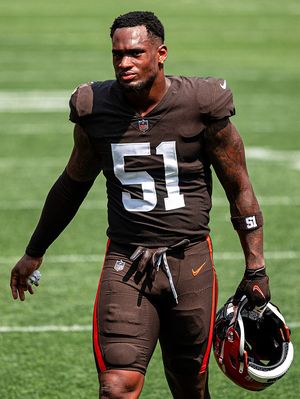 Mack WilsonLBCoaches-2
From Wikipedia’s 2018 all-conference team article, with the selectors that named each player (AP-1: the Associated Press’s first team).
2018 Southeastern Conference standings
Conference page| Team | Conf. | Overall | AP final |
|---|---|---|---|
| Alabama | 8–0 | 14–1 | 2 |
| Georgia | 7–1 | 11–3 | 7 |
 Kentucky | 5–3 | 10–3 | 12 |
 Florida | 5–3 | 10–3 | 7 |
| LSU | 5–3 | 10–3 | 6 |
| Texas A&M | 5–3 | 9–4 | 16 |
| Missouri | 4–4 | 8–5 | |
| Mississippi State | 4–4 | 8–5 | |
 South Carolina | 4–4 | 7–6 | |
| Auburn | 3–5 | 8–5 | |
 Vanderbilt | 3–5 | 6–7 | |
| Tennessee | 2–6 | 5–7 | |
| Ole Miss | 1–7 | 5–7 | |
| Arkansas | 0–8 | 2–10 |
Ordered by conference winning percentage, then conference wins. Division splits and tiebreakers aren’t applied.