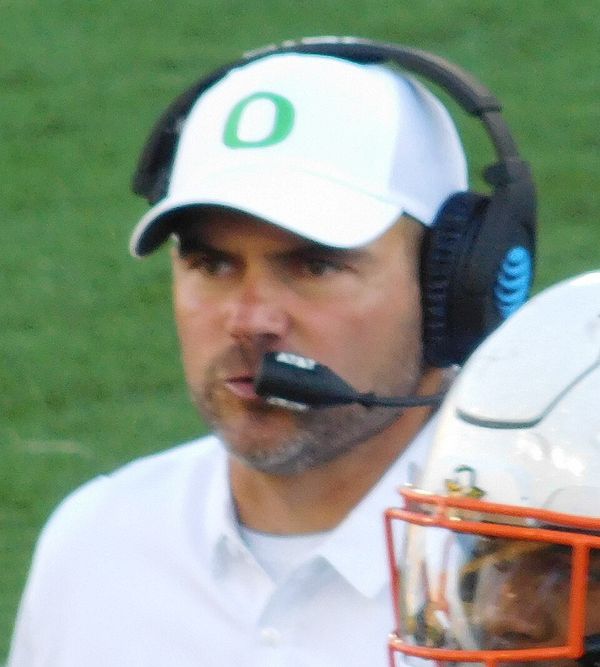
Mark Helfrich
Mark Helfrich went 37–16 as a head coach, 2013–2016, at Oregon. Share
- Record
- 37–16 career
- Seasons
- 4
- Schools
- 1
- Final AP top 10
- 2 seasons
- Born
- Oct 28, 1973
- Alma mater
- Southern Oregon 1996
- Best season
- 2014 13–2, No. 2
Season by season
| Season | School | Record | Conference finish | Bowl | AP final | |
|---|---|---|---|---|---|---|
| 2013 | Oregon | 11–2 | T–1st (North) | Alamo Bowl W | 9 | |
| 2014 | Oregon | 13–2 | 1st (North) | Rose Bowl, CFP Semifinal W; CFP National Championship L | 2 | |
| 2015 | Oregon | 9–4 | 2nd (North) | Alamo Bowl L | 19 | |
| 2016 | Oregon | 4–8 | 6th (North) |
Each season links to the team’s season page; bowls and playoff games link to the game. Conference finishes from the Wikipedia article’s record table.
Players he coached
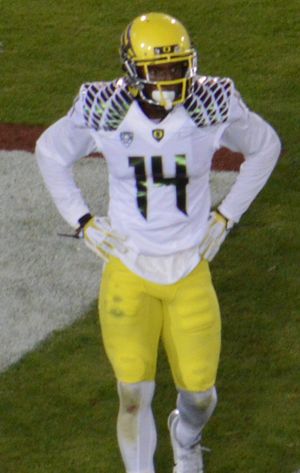
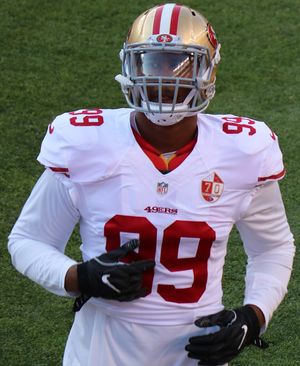
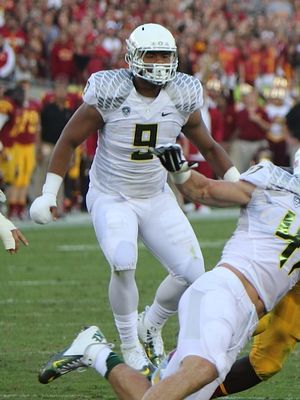

Every player from his seasons with a Heisman top-five finish, a national award, consensus All-America honors or a first-round pick. Photos: Wikimedia Commons, free licenses; credits on each player’s page.
How his teams did
| Kind of game | Games | Record | Won |
|---|---|---|---|
| Against ranked teams | 16 | 10–6 | 63% |
| Against top-10 teams | 8 | 4–4 | 50% |
| Against rivals | 14 | 9–5 | 64% |
| Conference games | 36 | 24–12 | 67% |
| Bowls and playoffs | 4 | 2–2 | 50% |
| Decided by 8 points or fewer | 14 | 6–8 | 43% |
| At home | 27 | 21–6 | 78% |
| On the road | 21 | 13–8 | 62% |
| At neutral sites | 5 | 3–2 | 60% |
| As our Elo’s favorite | 42 | 32–10 | 76% |
| As our Elo’s underdog | 11 | 5–6 | 45% |
His own 53 games on file, 2013–2016, as played (vacated wins counted, ties as half a win). Ranks are the AP poll going into the game; rivals are the ones either program’s Wikipedia article names; favorite and underdog by our own Elo rating, which reads only scores.
Against other head coaches
| Coach | Record | Their schools | Games | |
|---|---|---|---|---|
| Kyle Whittingham 2013–2016 | 3–1 | Utah | 4 | |
| Mike MacIntyre 2013–2016 | 3–1 | Colorado | 4 | |
| Sonny Dykes 2013–2016 | 3–1 | California | 4 | |
| David Shaw 2013–2016 | 2–2 | Stanford | 4 | |
| Mike Leach 2013–2016 | 2–2 | Washington State | 4 | |
| Mike Riley 2013–2016 | 2–1 | Oregon State, Nebraska | 3 | |
| Chris Petersen 2014–2016 | 2–1 | Washington | 3 | |
| Rich Rodriguez 2013–2014 | 1–2 | Arizona | 3 |
Mark Helfrich’s record against the head coaches he met three or more times, from the games on file, as played.
Most-faced opponents
| Opponent | Games | Record |
|---|---|---|
| Californiaseries | 4 | 3–1 |
| Coloradoseries | 4 | 3–1 |
| Oregon Stateseries | 4 | 3–1 |
| Utahseries | 4 | 3–1 |
| Washingtonseries | 4 | 3–1 |
| Stanfordseries | 4 | 2–2 |
| Washington Stateseries | 4 | 2–2 |
| Arizonaseries | 3 | 1–2 |
Career
| Years | Team | Job | |
|---|---|---|---|
| 1996 | Southern Oregon | Running backs coach | |
| 1997 | Oregon | Graduate assistant | |
| 1997 | Vienna Vikings | Offensive coordinator | |
| 1998–2000 | Boise State | Quarterbacks coach | |
| 2001–02 | Arizona State | Quarterbacks coach | |
| 2003–05 | Arizona State | Passing game coordinator and quarterbacks coach | |
| 2006–08 | Colorado | Offensive coordinator and quarterbacks coach | |
| 2009–12 | Oregon | Offensive coordinator and quarterbacks coach | |
| 2013–16 | Oregon | Head coach | |
| 2018–19 | Chicago Bears NFL | Offensive coordinator |
Every job as the infobox of his Wikipedia article lists it (CC BY-SA), assistant jobs included.
Coaching tree
Worked under
- Mike BellottiOregon
- Dirk KoetterBoise State, Arizona State
- Dan HawkinsColorado
- Chip KellyOregon
Assistants who became head coaches
- Scott FrostUCF, Nebraska
- Brady HokeBall State, San Diego State, Michigan, Tennessee
Worked under (4)
| Head coach | Team | Years | His job | |
|---|---|---|---|---|
| Mike Bellotti | Oregon | 1997 | Graduate assistant | |
| Dirk Koetter | Boise State | 1998–2000 | Quarterbacks coach | |
| Dirk Koetter | Arizona State | 2001–05 | 2001–02: quarterbacks coach; 2003–05: passing game coordinator and quarterbacks coach | |
| Dan Hawkins | Colorado | 2006–08 | Offensive coordinator and quarterbacks coach | |
| Chip Kelly | Oregon | 2009–12 | Offensive coordinator and quarterbacks coach |
Coached under him, later head coaches (2)
| Coach | With him | Head coach at | |
|---|---|---|---|
| Scott Frost | Oregon, 2013–15: offensive coordinator | UCF, Nebraska | |
| Brady Hoke | Oregon, 2016: defensive coordinator | Ball State, San Diego State, Michigan, Tennessee |
Other assistants under him (5)
| Coach | With him | |
|---|---|---|
| Don Pellum | Oregon, 2013, 2016: linebackers coach; 2014–15: defensive coordinator and inside linebackers coach | |
| Matt Lubick | Oregon, 2013–15: passing game coordinator and wide receivers coach; 2016: offensive coordinator and wide receivers coach | |
| Nick Aliotti | Oregon, 2013: defensive coordinator | |
| Erik Chinander | Oregon, 2014–15: outside linebackers coach | |
| David Yost | Oregon, 2016: passing game coordinator and quarterbacks coach |
From coaches’ Wikipedia infoboxes (CC BY-SA) and each season’s article for its coordinators: an assistant’s seasons at a school count under its head coach in our records; jobs in the NFL and elsewhere, under the head coach whose own article lists the job that year. Names without a page here link to their Wikipedia articles.
Pay
| Year | School | Job | Contract pay | |
|---|---|---|---|---|
| 2016 | Oregon | head coachbonuses up to $1,635,000; $150,000 in bonuses paid | $3,312,700 USA Today | |
| 2015 | Oregon | head coachbonuses up to $1,635,000; $535,000 in bonuses paid | $3,150,000 USA Today | |
| 2014 | Oregon | head coachbonuses up to $1,135,000 | $2,000,000 USA Today | |
| 2013 | Oregon | head coachbonuses up to $1,035,000 | $1,800,000 USA Today via Leeds |
USA Today’s coaches salary database (2014–17, from public-records requests to the schools; Rachel Ehlers’ copy): the season’s contract pay, school pay plus outside money, before bonuses.
The same USA Today database for 2006–16, from Michael Leeds’ replication data on Harvard Dataverse (CC0): the season’s contract pay.
Pay of public employees in their public job only: head coaches, and assistants in the seasons our records name them a coordinator, at public universities.
How he coached
Helfrich’s teams went for it on 30% of fourth downs and on 45% of those where the model said go for it, passed on 44% of plays and took 20.9 seconds a play, 2013–2016.
| Season | Went for it on fourth | When the model said go | Pass rate | Seconds a play | EPA a play | |
|---|---|---|---|---|---|---|
| 2013 13 g | 30 of 87 34% | 50% | 42% | 20.4 | +0.22 | |
| 2014 15 g | 26 of 92 28% | 45% | 45% | 21.3 | +0.28 | |
| 2015 13 g | 29 of 104 28% | 51% | 42% | 21.4 | +0.20 | |
| 2016 12 g | 28 of 98 29% | 36% | 48% | 20.3 | +0.19 | |
| All 53 g | 113 of 381 30% | 45% | 44% | 20.9 | +0.23 |
His seasons as a head coach from 2004 on, from ESPN’s play by play: fourth downs where he went for it out of every fourth-down decision; how often he went when SportsDataverse’s fourth-down model said going for it was the better call; the share of his offense’s plays that were passes; seconds of game clock per offensive play (lower is faster); and expected points added per offensive play (EPA, a measure of how much each play moved the offense toward points). The season in progress counts its games so far. SportsDataverse’s coach tendencies, from ESPN’s play by play; the EPA and the fourth-down model are SportsDataverse’s.