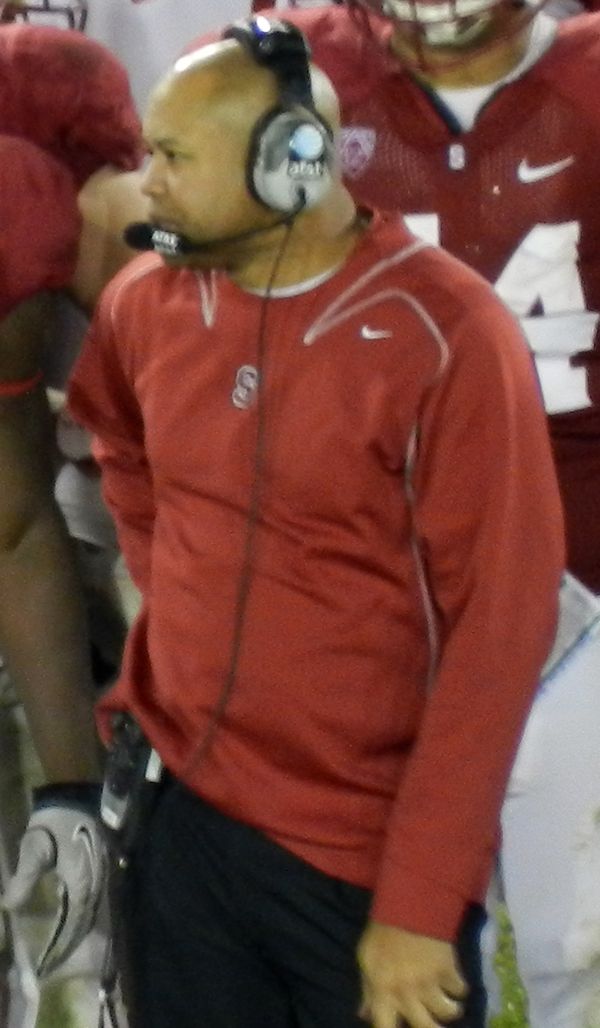
David Shaw
David Shaw went 96–54 as a head coach, 2011–2022, at Stanford. Share
- Record
- 96–54 career
- Seasons
- 12
- Schools
- 1
- Final AP top 10
- 3 seasons
- Born
- Jul 31, 1972
- Alma mater
- Stanford 1995
- Best season
- 2015 12–2, No. 3
Season by season
| Season | School | Record | Conference finish | Bowl | AP final | |
|---|---|---|---|---|---|---|
| 2011 | Stanford | 11–2 | T–1st (North) | Fiesta Bowl L | 7 | |
| 2012 | Stanford | 12–2 | T–1st (North) | Rose Bowl W | 7 | |
| 2013 | Stanford | 11–3 | T–1st (North) | Rose Bowl L | 11 | |
| 2014 | Stanford | 8–5 | 2nd (North) | Foster Farms Bowl W | ||
| 2015 | Stanford | 12–2 | 1st (North) | Rose Bowl W | 3 | |
| 2016 | Stanford | 10–3 | 3rd (North) | Sun Bowl W | 12 | |
| 2017 | Stanford | 9–5 | T–1st (North) | Alamo Bowl L | 20 | |
| 2018 | Stanford | 9–4 | 3rd (North) | Sun Bowl W | ||
| 2019 | Stanford | 4–8 | T–5th (North) | |||
| 2020 | Stanford | 4–2 | 3rd (North) | |||
| 2021 | Stanford | 3–9 | 6th (North) | |||
| 2022 | Stanford | 3–9 | T–11th |
Each season links to the team’s season page; bowls and playoff games link to the game. Conference finishes from the Wikipedia article’s record table.
Players he coached
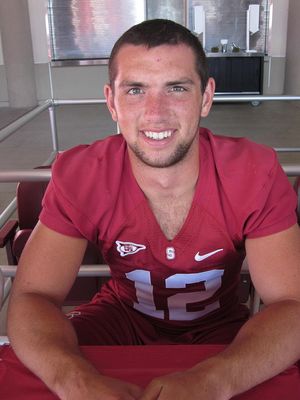
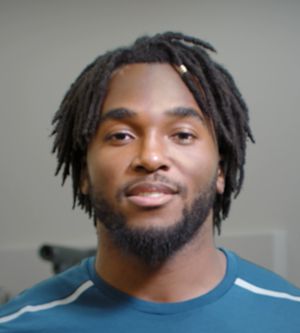
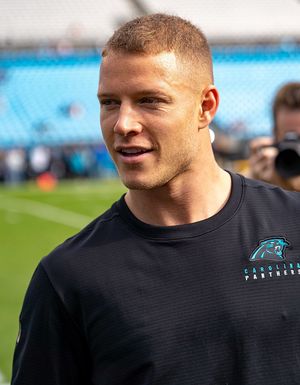
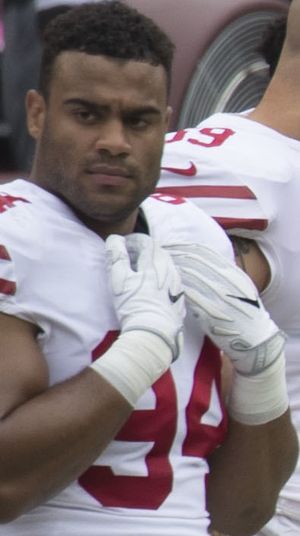
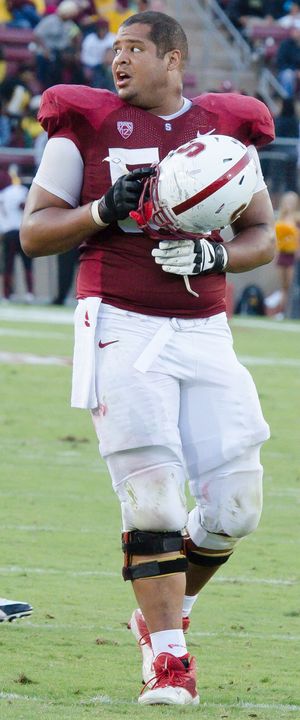
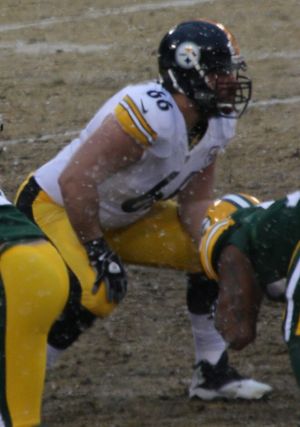

 Joshua Garnett2015 Outland Trophy
- Zach ErtzConsensus All‑American, 2012
- Trent MurphyConsensus All‑American, 2013
- Ty MontgomeryConsensus All‑American, 2013
- Andrus PeatNo. 13 pick, 2015
- Isaiah Sanders2021 Wuerffel Trophy
Every player from his seasons with a Heisman top-five finish, a national award, consensus All-America honors or a first-round pick. Photos: Wikimedia Commons, free licenses; credits on each player’s page.
How his teams did
| Kind of game | Games | Record | Won |
|---|---|---|---|
| Against ranked teams | 57 | 29–28 | 51% |
| Against top-10 teams | 22 | 11–11 | 50% |
| Against rivals | 64 | 41–23 | 64% |
| Conference games | 105 | 65–40 | 62% |
| Bowls and playoffs | 8 | 5–3 | 63% |
| Decided by 8 points or fewer | 59 | 35–24 | 59% |
| At home | 71 | 49–22 | 69% |
| On the road | 65 | 38–27 | 58% |
| At neutral sites | 14 | 9–5 | 64% |
| As our Elo’s favorite | 108 | 80–28 | 74% |
| As our Elo’s underdog | 42 | 16–26 | 38% |
His own 150 games on file, 2011–2022, as played (vacated wins counted, ties as half a win). Ranks are the AP poll going into the game; rivals are the ones either program’s Wikipedia article names; favorite and underdog by our own Elo rating, which reads only scores.
Against other head coaches
| Coach | Record | Their schools | Games | |
|---|---|---|---|---|
| Brian Kelly 2011–2021 | 5–5 | Notre Dame | 10 | |
| Mike Leach 2012–2019 | 4–4 | Washington State | 8 | |
| Jim Mora 2012–2017 | 7–0 | UCLA | 7 | |
| Clay Helton 2015–2021 | 4–3 | USC | 7 | |
| Chip Kelly 2011–2022 | 3–4 | Oregon, UCLA | 7 | |
| Chris Petersen 2014–2019 | 4–2 | Washington | 6 | |
| Justin Wilcox 2017–2022 | 3–3 | California | 6 | |
| Kyle Whittingham 2013–2022 | 1–5 | Utah | 6 | |
| Steve Sarkisian 2011–2015 | 3–2 | Washington, USC | 5 | |
| Jonathan Smith 2018–2022 | 3–2 | Oregon State | 5 |
David Shaw’s record against the head coaches he met three or more times, from the games on file, as played.
Most-faced opponents
| Opponent | Games | Record |
|---|---|---|
| UCLAseries | 13 | 10–3 |
| USCseries | 13 | 7–6 |
| Oregon Stateseries | 12 | 10–2 |
| Californiaseries | 12 | 9–3 |
| Washingtonseries | 12 | 7–5 |
| Oregonseries | 12 | 6–6 |
| Notre Dameseries | 11 | 6–5 |
| Washington Stateseries | 11 | 5–6 |
National coaching awards
The awards- 2017 Stanford: Bobby Dodd Award
Career
| Years | Team | Job | |
|---|---|---|---|
| 1995 | Western Washington | Outside linebackers coach | |
| 1996 | Western Washington | Tight ends coach | |
| 1997 | Philadelphia Eagles NFL | Offensive quality control coach | |
| 1998–2000 | Oakland Raiders NFL | Offensive quality control coach | |
| 2001 | Oakland Raiders NFL | Quarterbacks coach | |
| 2002–04 | Baltimore Ravens NFL | Quarterbacks and wide receivers coach | |
| 2005 | Baltimore Ravens NFL | Wide receivers coach | |
| 2006 | San Diego | Passing game coordinator and wide receivers coach | |
| 2007–09 | Stanford | Offensive coordinator and wide receivers coach | |
| 2010 | Stanford | Offensive coordinator and running backs coach | |
| 2011–22 | Stanford | Head coach | |
| 2025 | Detroit Lions NFL | Passing game coordinator | |
| 2026–present | Detroit Lions NFL | Passing game specialist |
Every job as the infobox of his Wikipedia article lists it (CC BY-SA), assistant jobs included.
Coaching tree
Worked under
- Brian BillickBaltimore Ravens
- Jim HarbaughSan Diego, Stanford
Assistants who became head coaches
- Brian PolianNevada, John Carroll
- Derek MasonVanderbilt, Middle Tennessee
- Lance AndersonUtah Tech
- Mike Sanford Jr.Western Kentucky, Colorado
- Pep HamiltonDC Defenders
- Tavita PritchardStanford
- Dave KotulskiBucknell
- Pete AlamarRice
- Mike BloomgrenRice
- Lance TaylorWestern Michigan
Worked under (2)
| Head coach | Team | Years | His job | |
|---|---|---|---|---|
| Brian Billick | Baltimore Ravens NFL | 2002–05 | 2002–04: quarterbacks and wide receivers coach; 2005: wide receivers coach | |
| Jim Harbaugh | San Diego | 2006 | Passing game coordinator and wide receivers coach | |
| Jim Harbaugh | Stanford | 2007–10 | 2007–09: offensive coordinator and wide receivers coach; 2010: offensive coordinator and running backs coach |
Coached under him, later head coaches (10)
| Coach | With him | Head coach at | |
|---|---|---|---|
| Brian Polian | Stanford, 2011: special teams and safeties coach and recruiting coordinator | Nevada, John Carroll | |
| Derek Mason | Stanford, 2011: assistant head coach, co-defensive coordinator and defensive backs coach; 2012–13: assistant head coach and defensive coordinator | Vanderbilt, Middle Tennessee | |
| Lance Anderson | Stanford, 2011–13: outside linebackers coach and recruiting coordinator; 2014–17: defensive coordinator and outside linebackers coach; 2018–22: assistant head coach, defensive coordinator and outside linebackers coach | Utah Tech | |
| Mike Sanford Jr. | Stanford, 2011: running backs coach; 2012: recruiting coordinator and running backs coach; 2013: recruiting coordinator and quarterbacks and wide receivers coach | Western Kentucky, Colorado | |
| Pep Hamilton | Stanford, 2011–12: offensive coordinator and quarterbacks coach | DC Defenders | |
| Tavita Pritchard | Stanford, 2011–12: defensive assistant; 2013: running backs coach; 2014–17: quarterbacks and wide receivers coach; 2018–22: offensive coordinator and quarterbacks coach | Stanford | |
| Dave Kotulski | Stanford, 2012–13: inside linebackers coach | Bucknell | |
| Pete Alamar | Stanford, 2012–22: special teams and tight ends coach | Rice | |
| Mike Bloomgren | Stanford, 2013–17: offensive coordinator | Rice | |
| Lance Taylor | Stanford, 2014–16: running backs coach | Western Michigan |
Other assistants under him (6)
| Coach | With him | |
|---|---|---|
| Jason Tarver | Stanford, 2011: defensive coordinator and linebackers coach | |
| Nick Holz | Stanford, 2011: offensive assistant, operations assistant and assistant quarterbacks coach | |
| Randy Hart | Stanford, 2011–15: defensive line coach | |
| Duane Akina | Stanford, 2014–22: defensive backs coach | |
| Peter Hansen | Stanford, 2014–19: inside linebackers coach | |
| Eric Sanders | Stanford, 2015: defensive assistant; 2020–22: inside linebackers coach |
From coaches’ Wikipedia infoboxes (CC BY-SA) and each season’s article for its coordinators: an assistant’s seasons at a school count under its head coach in our records; jobs in the NFL and elsewhere, under the head coach whose own article lists the job that year. Names without a page here link to their Wikipedia articles.
How he coached
Shaw’s teams went for it on 15% of fourth downs and on 28% of those where the model said go for it, passed on 48% of plays and took 28.6 seconds a play, 2011–2022.
| Season | Went for it on fourth | When the model said go | Pass rate | Seconds a play | EPA a play | |
|---|---|---|---|---|---|---|
| 2011 13 g | 12 of 72 17% | 23% | 46% | 28.1 | +0.19 | |
| 2012 14 g | 13 of 113 12% | 20% | 44% | 27.6 | −0.05 | |
| 2013 14 g | 14 of 90 16% | 25% | 35% | 29.2 | +0.09 | |
| 2014 13 g | 10 of 90 11% | 19% | 48% | 28.8 | +0.03 | |
| 2015 14 g | 16 of 78 21% | 36% | 37% | 30.9 | +0.20 | |
| 2016 13 g | 12 of 92 13% | 27% | 41% | 29.6 | −0.01 | |
| 2017 14 g | 13 of 93 14% | 32% | 45% | 29.2 | +0.14 | |
| 2018 13 g | 12 of 89 13% | 22% | 56% | 28.4 | +0.06 | |
| 2019 12 g | 14 of 94 15% | 31% | 60% | 28.4 | +0.02 | |
| 2020 6 g | 7 of 38 18% | 41% | 56% | 27.4 | +0.20 | |
| 2021 11 g | 13 of 77 17% | 29% | 58% | 29.0 | −0.03 | |
| 2022 12 g | 21 of 94 22% | 38% | 59% | 25.3 | −0.03 | |
| All 149 g | 157 of 1020 15% | 28% | 48% | 28.6 | +0.06 |
His seasons as a head coach from 2004 on, from ESPN’s play by play: fourth downs where he went for it out of every fourth-down decision; how often he went when SportsDataverse’s fourth-down model said going for it was the better call; the share of his offense’s plays that were passes; seconds of game clock per offensive play (lower is faster); and expected points added per offensive play (EPA, a measure of how much each play moved the offense toward points). The season in progress counts its games so far. SportsDataverse’s coach tendencies, from ESPN’s play by play; the EPA and the fourth-down model are SportsDataverse’s.