
2009 USC
9–4 (5–4 Pac-10), coached by Pete Carroll, finished No. 22 in the AP poll. Share
Schedule and results
- Best winBeat No. 8 Ohio State 18–15Sep 12
Over the best-ranked team it beat, on the road.
| Date | Opponent | Result | Elo |
|---|---|---|---|
| Sep 5 | vs San José State | W 56–3 | 88% |
| Sep 12 | at 8Ohio State | W 18–15 | 51% |
| Sep 19 | at Washington | L 13–16 | 87% |
| Sep 26 | vs Washington State | W 27–6 | 93% |
| Oct 3 | at 24California | W 30–3 | 58% |
| Oct 17 | at 25Notre Dame | W 34–27 | 67% |
| Oct 24 | vs Oregon State | W 42–36 | 78% |
| Oct 31 | at 10Oregon | L 20–47 | 51% |
| Nov 7 | at Arizona State | W 14–9 | 75% |
| Nov 14 | vs 25Stanford | L 21–55 | 80% |
| Nov 28 | vs UCLA | W 28–7 | 81% |
| Dec 5 | vs Arizona | L 17–21 | 71% |
| Dec 26Bowls & playoff | vs Boston CollegeEmerald Bowl | W 24–13 | 62% |
Elo: a pregame chance from scores alone.
How it ended: Beat Boston College 24–13 in the Emerald Bowl; No. 22 in the final AP poll; tied for 5th in the Pac-10.
In program history: The 37th-best season in program history by end-of-season Elo (of 112 on file).
AP poll, week by week
- Wk 1: 4
- Wk 2: 3
- Wk 3: 3
- Wk 4: 12
- Wk 5: 7
- Wk 6: 7
- Wk 7: 6
- Wk 8: 4
- Wk 9: 4
- Wk 10: 12
- Wk 11: 11
- Wk 12: 22
- Wk 13: 24
- Wk 14: 20
- Final: 22
- Record
- 9–4
- Conference
- 5–4 tied for 5th in Pac-10
- AP final
- No. 22 peak No. 3
- Points
- 344–258
- Coach
- Pete Carroll
- Elo
- 1694 −40 this season
- SP+ rating
- 16.6 No. 22 of 120; offense No. 22, defense No. 25, special teams No. 98
- SRS
- 8.6 No. 25 of 120 in FBS
- Recruiting class
- No. 2
- Offensive coordinator
- John Morton
- Defensive coordinator
- Rocky Seto
- Captains
- Jeff Byers, Taylor Mays, Josh Pinkard and Damian Williams
- Offense
- Multiple
- Defense
- 4–3
How good, play by play
| EPA per play | Success | Explosiveness | FBS rank | |
|---|---|---|---|---|
| Offense | 0.09 | 41% | 0.95 | 26th of 120 |
| Defense | 0.04 | 41% | 0.94 | 58th of 120 |
| Opponent-adjusted | 0.08 off 0.05 def | 42% off 42% def | — | 25th off 63rd def |
How these are measured
Play-weighted averages over games against FBS opponents; raw numbers, not adjusted for the strength of the opponent. EPA (expected points added) measures how much each play changed the expected score; success rate counts plays that kept the offense on schedule; explosiveness is the average EPA on successful plays. Lower is better on defense. Ranked by EPA per play among teams that were FBS that season. The opponent-adjusted row (offense / defense) is CollegeFootballData.com’s WEPA, which accounts for who each team played.
Drives and havoc
| Points per trip inside the 40 | Average start | Havoc | |
|---|---|---|---|
| Offense | -0.2 | own 31 | 2% allowed |
| Defense | -0.1 | own 30 | 3% caused |
A trip inside the 40 is a drive that reaches the opponent’s 40-yard line; points per trip is how many it scored on average (allowed, on defense). Average start is where drives began (the defense’s line is where its opponents started). Havoc is the share of plays ending in a tackle for loss, a forced fumble, an interception or a pass broken up. From CollegeFootballData.com.
Leaders
| Passing yards | Matt Barkley QB | 2,735 yds |
| Passing touchdowns | Matt Barkley QB | 15 TD |
| Rushing yards | Joe McKnight | 1,014 yds |
| Rushing touchdowns | Allen Bradford | 8 TD |
| Receiving yards | Damian Williams WR | 1,010 yds |
| Receiving touchdowns | Damian Williams WR | 6 TD |
| Interceptions | Will Harris S | 4 INT |
Top recruits in the 2009 class
| Matt Barkley PRO | ★★★★★ | No. 1 |
| Devon Kennard WDE | ★★★★★ | No. 12 |
| T.J. McDonald S | ★★★★★ | No. 32 |
| Patrick Hall ATH | ★★★★ | No. 42 |
| Kevin Graf OT | ★★★★ | No. 46 |
| Jarvis Jones OLB | ★★★★ | No. 49 |
| John Martinez OG | ★★★★ | No. 60 |
| Byron Moore S | ★★★★ | No. 64 |
247Sports composite rankings via CollegeFootballData.com; national rank in the class.
The 2009 class by position
| Signed | Stars | Rating | |
|---|---|---|---|
| Quarterbacks | 1 | 5.0 | 0.999 |
| Running backs | 1 | 3.0 | 0.846 |
| Receivers | 1 | 4.0 | 0.909 |
| Offensive line | 2 | 4.0 | 0.973 |
| Defensive line | 1 | 5.0 | 0.993 |
| Linebackers | 3 | 4.0 | 0.958 |
| Defensive backs | 4 | 4.3 | 0.948 |
| Athletes and specialists | 2 | 4.0 | 0.946 |
| Whole class | 15 | 4.1 | 0.950 |
High-school signees by position group, with their average stars and 247Sports composite rating (out of 1), via CollegeFootballData.com. Athletes are signees with no set position.
Drafted in 2010
The 2010 draft| Rd 2 | Taylor Mays S | San Francisco 49ers |
| Rd 2 | Charles Brown OT | New Orleans Saints |
| Rd 3 | Damian Williams WR | Tennessee Titans |
| Rd 3 | Kevin Thomas CB | Indianapolis Colts |
| Rd 4 | Everson Griffen DE | Minnesota Vikings |
| Rd 4 | Joe McKnight RB | New York Jets |
| Rd 6 | Anthony McCoy TE | Seattle Seahawks |
Roster 107
The 2009 roster107 players, with numbers, heights, hometowns and each player’s 2009 line; 31 have a stat line. See the roster
All-Pac-10
4 first team, 4 second teamFirst team
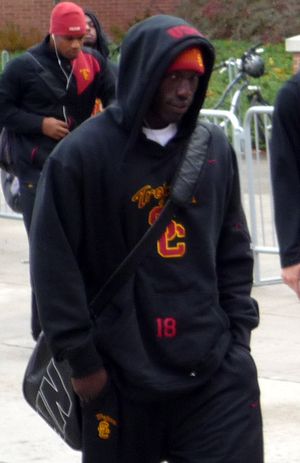 Damian WilliamsWRCoaches-1; ESPN-1
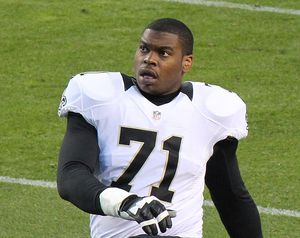 Charles BrownOTCoaches-1; ESPN-1
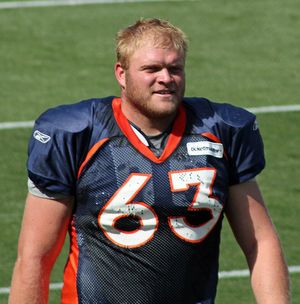 Jeff ByersOGCoaches-1; ESPN-1
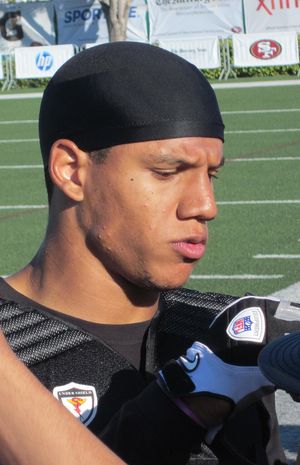 Taylor MaysSCoaches-1; ESPN-1
Second team
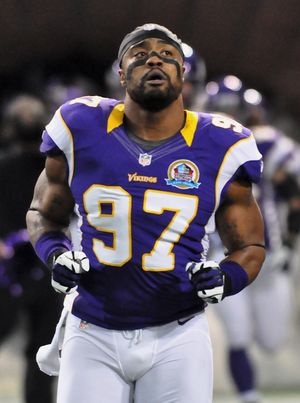 Everson GriffenDECoaches-2
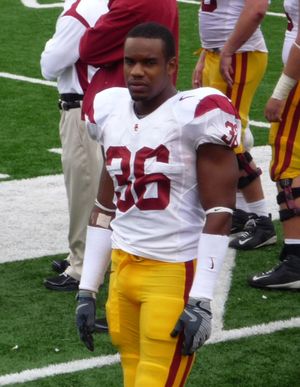 Josh PinkardCBCoaches-2
 Kevin ThomasCBCoaches-2
- Garrett GreenSpecial teams playerCoaches-2
From Wikipedia’s 2009 all-conference team article, with the selectors that named each player (AP-1: the Associated Press’s first team).
2009 Pac-10 standings
| Team | Conf. | Overall | AP final |
|---|---|---|---|
| Oregon | 8–1 | 10–3 | 11 |
| Oregon State | 6–3 | 8–5 | |
| Arizona | 6–3 | 8–5 | |
| Stanford | 6–3 | 8–5 | |
| USC | 5–4 | 9–4 | 22 |
| California | 5–4 | 8–5 | |
| Washington | 4–5 | 5–7 | |
| UCLA | 3–6 | 7–6 | |
| Arizona State | 2–7 | 4–8 | |
| Washington State | 0–9 | 1–11 |
Ordered by conference winning percentage, then conference wins. Division splits and tiebreakers aren’t applied.