
2003 Tennessee
10–3 (6–2 Southeastern Conference), coached by Phillip Fulmer, finished No. 15 in the AP poll. Share
Schedule and results
- Biggest upsetBeat No. 6 Miami 10–6Nov 8
Miami was ranked No. 6, above it.
| Date | Opponent | Result | Elo |
|---|---|---|---|
| Aug 30 | vs Fresno State | W 24–6 | 60% |
| Sep 6 | vs Marshall | W 34–24 | 57% |
| Sep 20 | at 17Florida | W 24–10 | 43% |
| Sep 27 | vs South Carolina | W 23–20 | 73% |
| Oct 4 | at Auburn | L 21–28 | 54% |
| Oct 11 | vs 8Georgia | L 14–41 | 48% |
| Oct 25 | at Alabama | W 51–43 | 46% |
| Nov 1 | vs Duke | W 23–6 | 90% |
| Nov 8 | at 6Miami | W 10–6 | 27% |
| Nov 15 | vs Mississippi State | W 59–21 | 89% |
| Nov 22 | vs Vanderbilt | W 48–0 | 91% |
| Nov 29 | at Kentucky | W 20–7 | 73% |
| Jan 2Bowls & playoff | vs ClemsonPeach Bowl | L 14–27 | 60% |
Elo: a pregame chance from scores alone.
How it ended: Lost to Clemson 27–14 in the Peach Bowl; No. 15 in the final AP poll; tied for 3rd in the Southeastern Conference.
In program history: The 50th-best season in program history by end-of-season Elo (of 123 on file).
AP poll, week by week
- Wk 1: 12
- Wk 3: 12
- Wk 4: 13
- Wk 5: 12
- Wk 6: 8
- Wk 7: 7
- Wk 8: 13
- Wk 9: 21
- Wk 10: 22
- Wk 11: 19
- Wk 12: 18
- Wk 13: 9
- Wk 14: 9
- Wk 15: 7
- Wk 16: 7
- Final: 15
Players on this team
 Dustin ColquittPunter
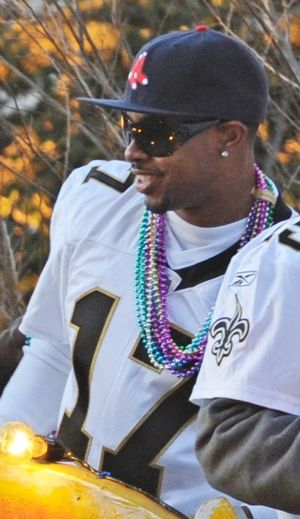 Robert MeachemReceiver
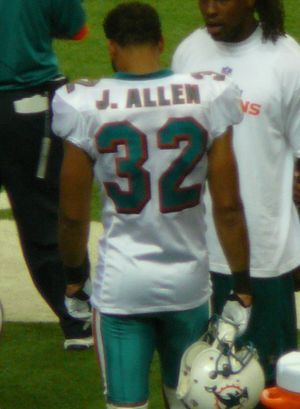 Jason AllenDefensive back
 Justin HarrellDefensive tackle
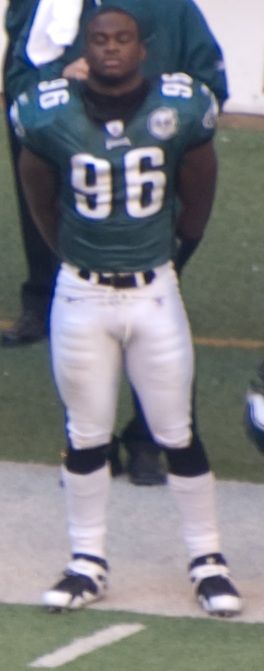 Omar GaitherLinebacker
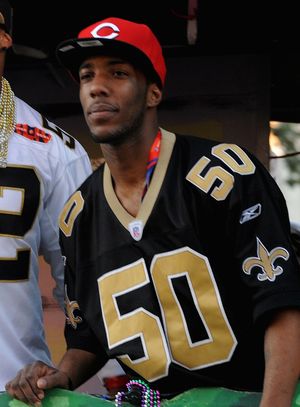 Marvin MitchellLinebacker
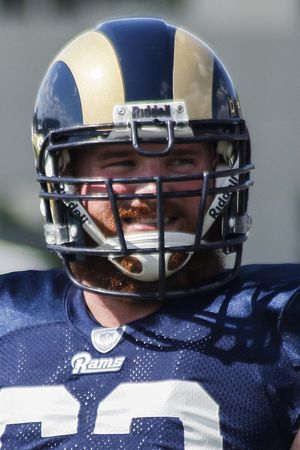 Scott WellsCenter
- Jonathan WadeDefensive back
- Cedric HoustonRunning back
- Arron SearsGuard
- Gerald Riggs Jr.Running back
- James WilhoitKicker
Before 2004 our records hold honors and the draft; these are the players whose college years here, from their Wikipedia articles or their honors, include 2003.
SEC East champions6–2 in the conference, shared with Florida and Georgia
- Record
- 10–3
- Conference
- 6–2 tied for 3rd in Southeastern Conference
- AP final
- No. 15 peak No. 7
- Points
- 365–239
- Coach
- Phillip Fulmer
- Elo
- 1658 +75 this season
- SP+ rating
- 16.2 No. 22 of 117; offense No. 44, defense No. 17
- SRS
- 10.7 No. 22 of 117 in Division I-A
- Recruiting class
- No. 10
- Offensive coordinator
- Randy Sanders
- Defensive coordinator
- John Chavis
- Offense
- Pro-style
- Defense
- Multiple 4–3
Drives and havoc
| Points per trip inside the 40 | Average start | Havoc | |
|---|---|---|---|
| Offense | 0.0 | own 28 | — allowed |
| Defense | -0.1 | own 28 | — caused |
A trip inside the 40 is a drive that reaches the opponent’s 40-yard line; points per trip is how many it scored on average (allowed, on defense). Average start is where drives began (the defense’s line is where its opponents started). Havoc is the share of plays ending in a tackle for loss, a forced fumble, an interception or a pass broken up. From CollegeFootballData.com.
Top recruits in the 2003 class
| Robert Meachem WR | ★★★★★ | No. 25 |
| Daniel Brooks ILB | ★★★★ | No. 35 |
| Jayson Swain WR | ★★★★ | No. 49 |
| Bo Hardegree PRO | ★★ | No. 1047 |
| Bill Grimes WR | ★★ | No. 1050 |
247Sports composite rankings via CollegeFootballData.com; national rank in the class.
The 2003 class by position
| Signed | Stars | Rating | |
|---|---|---|---|
| Quarterbacks | 1 | 2.0 | 0.789 |
| Running backs | 1 | 2.0 | 0.767 |
| Receivers | 3 | 3.7 | 0.911 |
| Linebackers | 1 | 4.0 | 0.983 |
| Whole class | 6 | 3.2 | 0.878 |
High-school signees by position group, with their average stars and 247Sports composite rating (out of 1), via CollegeFootballData.com. Athletes are signees with no set position.
Drafted in 2004
The 2004 draft| Rd 5 | Gibril Wilson DB | New York Giants |
| Rd 6 | Troy Fleming RB | Tennessee Titans |
| Rd 7 | Mark Jones WR | Tampa Bay Buccaneers |
| Rd 7 | Scott Wells C | Green Bay Packers |
All-SEC
2 first team, 6 second teamFirst team
- Scott WellsCAP-2; Coaches-1
- Dustin ColquittPAP-1; Coaches-1
Second team
 Cedric HoustonRBCoaches-2
- Michael MuñozOTCoaches-2
- Kevin SimonLBAP-2; Coaches-2
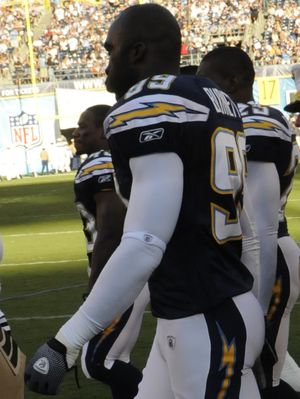 Kevin BurnettLBCoaches-2
 Gibril WilsonSAP-2; Coaches-2
- Rashad BakerSAP-2
From Wikipedia’s 2003 all-conference team article, with the selectors that named each player (AP-1: the Associated Press’s first team).
2003 Southeastern Conference standings
Conference page| Team | Conf. | Overall | AP final |
|---|---|---|---|
 LSU | 7–1 | 13–1 | 2 |
 Ole Miss | 7–1 | 10–3 | 13 |
| Georgia | 6–2 | 11–3 | 7 |
| Tennessee | 6–2 | 10–3 | 15 |
| Florida | 6–2 | 8–5 | 24 |
| Auburn | 5–3 | 8–5 | |
 Arkansas | 4–4 | 9–4 | |
| South Carolina | 2–6 | 5–7 | |
| Alabama | 2–6 | 4–9 | |
| Kentucky | 1–7 | 4–8 | |
| Mississippi State | 1–7 | 2–10 | |
| Vanderbilt | 1–7 | 2–10 |
Ordered by conference winning percentage, then conference wins. Division splits and tiebreakers aren’t applied.