2018 Oklahoma
12–2 (8–1 Big 12), coached by Lincoln Riley, finished No. 4 in the AP poll. Share
Schedule and results
- Best winBeat No. 9 Texas 39–27Dec 1
Over the best-ranked team it beat, at a neutral site.
- Most excitingBeat No. 12 West Virginia 59–56Nov 23
The win probability swung the most, by CollegeFootballData.com’s excitement index.
| Date | Opponent | Result | Elo |
|---|---|---|---|
| Sep 1 | vs Florida Atlantic | W 63–14 | 72% |
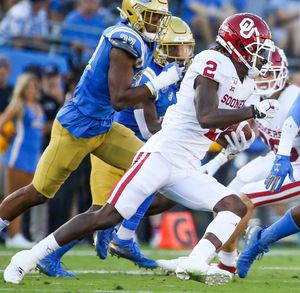
| Sep 8 | vs UCLA | W 49–21 | 86% |
| Sep 15 | at Iowa State | W 37–27 | 69% |
| Sep 22 | vs Army | W 28–21 | 80% |
| Sep 29 | vs Baylor | W 66–33 | 87% |
| Oct 6 | vs 19Texas | L 45–48 | 68% |
| Oct 20 | at TCU | W 52–27 | 62% |
| Oct 27 | vs Kansas State | W 51–14 | 83% |
| Nov 3 | at Texas Tech | W 51–46 | 72% |
| Nov 10 | vs Oklahoma State | W 48–47 | 83% |
| Nov 17 | vs Kansas | W 55–40 | 95% |
| Nov 23 | at 12West Virginia | W 59–56 | 64% |
| Dec 1 | vs9TexasBig 12 Championship Game | W 39–27 | 67% |
| Dec 29Bowls & playoff | vs 1AlabamaOrange Bowl, CFP Semifinal | L 34–45 | 36% |
Elo: a pregame chance from scores alone.
How it ended: Lost to Alabama 45–34 in the Orange Bowl, CFP Semifinal; No. 4 in the final AP poll; Big 12 champions.
In program history: The 20th-best season in program history by end-of-season Elo (of 125 on file).
AP poll, week by week
- Wk 1: 7
- Wk 2: 6
- Wk 3: 5
- Wk 4: 5
- Wk 5: 6
- Wk 6: 7
- Wk 7: 11
- Wk 8: 9
- Wk 9: 8
- Wk 10: 7
- Wk 11: 6
- Wk 12: 6
- Wk 13: 6
- Wk 14: 5
- Wk 15: 4
- Final: 4
Big 12 champions8–1 in the conference, won the Big 12 Championship Game
Led the nationKyler Murray: total offense (5,362 yds), total offense per game (383.0)
Heisman TrophyKyler Murray, QB; also the Davey O’Brien and Manning
- Record
- 12–2
- Conference
- 8–1 first in Big 12
- AP final
- No. 4 peak No. 4
- Points
- 677–466
- Coach
- Lincoln Riley
- Elo
- 1795 +94 this season
- SP+ rating
- 24.9 No. 4 of 130; offense No. 1, defense No. 84, special teams No. 30
- SRS
- 17.8 No. 4 of 130 in FBS
- Returning
- 41% of last season’s EPA, No. 102 of 130
- Recruiting class
- No. 9 roster talent No. 11 in FBS
- Offensive coordinators
- Cale Gundy and Bill Bedenbaugh
- Defensive coordinators
- Mike Stoops and Ruffin McNeill
- Captains
- Rodney Anderson, Kenneth Mann, Kenneth Murray, Ben Powers and Austin Seibert
- Offense
- Air raid
- Defense
- 3–4
How good, play by play
| EPA per play | Success | Explosiveness | FBS rank | |
|---|---|---|---|---|
| Offense | 0.45 | 55% | 1.37 | 1st of 130 |
| Defense | 0.25 | 48% | 1.25 | 121st of 130 |
| Opponent-adjusted | 0.40 off 0.19 def | 54% off 45% def | — | 1st off 117th def |
How these are measured
Play-weighted averages over games against FBS opponents; raw numbers, not adjusted for the strength of the opponent. EPA (expected points added) measures how much each play changed the expected score; success rate counts plays that kept the offense on schedule; explosiveness is the average EPA on successful plays. Lower is better on defense. Ranked by EPA per play among teams that were FBS that season. The opponent-adjusted row (offense / defense) is CollegeFootballData.com’s WEPA, which accounts for who each team played.
Drives and havoc
| Points per trip inside the 40 | Average start | Havoc | |
|---|---|---|---|
| Offense | 4.8 | own 28 | 12% allowed |
| Defense | 4.3 | own 28 | 14% caused |
CORE rating 23.2, 4th of 130 (offense 31.2, defense 8.0).
A trip inside the 40 is a drive that reaches the opponent’s 40-yard line; points per trip is how many it scored on average (allowed, on defense). Average start is where drives began (the defense’s line is where its opponents started). Havoc is the share of plays ending in a tackle for loss, a forced fumble, an interception or a pass broken up. CORE is CollegeFootballData.com’s context- and opponent-adjusted rating (points better than an average team; lower is better on defense). From CollegeFootballData.com.
Leaders
| Passing yards | Kyler Murray QB | 4,364 yds |
| Passing touchdowns | Kyler Murray QB | 42 TD |
| Rushing yards | Kennedy Brooks RB | 1,056 yds |
| Rushing touchdowns | Trey Sermon RB | 13 TD |
| Receiving yards | Marquise Brown WR | 1,318 yds |
| Receiving touchdowns | CeeDee Lamb WR | 11 TD |
| Tackles | Kenneth Murray LB | 155 tkl |
| Sacks | Ronnie Perkins DE | 5 sacks |
| Interceptions | Parnell Motley CB | 2 INT |
Top recruits in the 2018 class
| Brey Walker OT | ★★★★★ | No. 29 |
| Brendan Radley-Hiles CB | ★★★★ | No. 38 |
| Ronnie Perkins WDE | ★★★★ | No. 66 |
| Michael Thompson DT | ★★★★ | No. 72 |
| T.J. Pledger APB | ★★★★ | No. 100 |
| Ron Tatum SDE | ★★★★ | No. 101 |
| Jalen Redmond WDE | ★★★★ | No. 135 |
| Jaquayln Crawford ATH | ★★★★ | No. 183 |
247Sports composite rankings via CollegeFootballData.com; national rank in the class.
The 2018 class by position
| Signed | Stars | Rating | |
|---|---|---|---|
| Quarterbacks | 1 | 4.0 | 0.909 |
| Running backs | 1 | 4.0 | 0.954 |
| Receivers | 3 | 2.7 | 0.813 |
| Offensive line | 2 | 4.5 | 0.945 |
| Defensive line | 5 | 3.8 | 0.942 |
| Linebackers | 3 | 3.7 | 0.904 |
| Defensive backs | 5 | 3.2 | 0.892 |
| Athletes and specialists | 4 | 3.0 | 0.870 |
| Whole class | 24 | 3.5 | 0.898 |
High-school signees by position group, with their average stars and 247Sports composite rating (out of 1), via CollegeFootballData.com. Athletes are signees with no set position.
Drafted in 2019
The 2019 draft| Rd 1 | Kyler Murray QB | Arizona Cardinals |
| Rd 1 | Marquise Brown WR | Baltimore Ravens |
| Rd 2 | Cody Ford OT | Buffalo Bills |
| Rd 3 | Bobby Evans OT | Los Angeles Rams |
| Rd 4 | Dru Samia OG | Minnesota Vikings |
| Rd 4 | Ben Powers OG | Baltimore Ravens |
| Rd 5 | Austin Seibert K | Cleveland Browns |
| Rd 6 | Rodney Anderson RB | Cincinnati Bengals |
Roster 121
The 2018 roster121 players, with numbers, heights, hometowns and each player’s 2018 line; 60 have a stat line. See the roster
All-Big 12
7 first team, 6 second teamFirst team
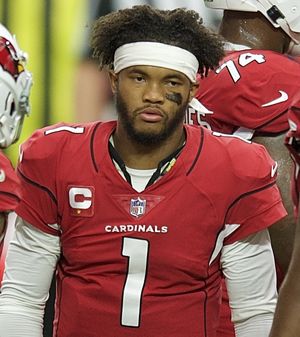 Kyler MurrayQBCoaches-1; Media-1
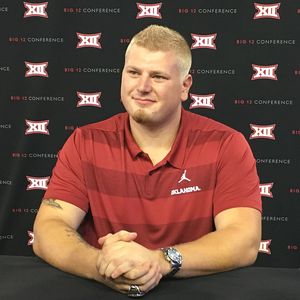 Ben PowersOGCoaches-1; Media-1
 Dru SamiaOGCoaches-1; Media-1
- Bobby EvansOTCoaches-1; Media-2
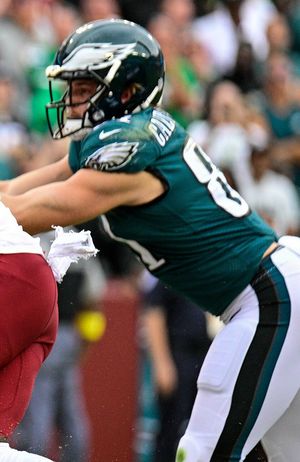 Grant CalcaterraTECoaches-1; Media-1
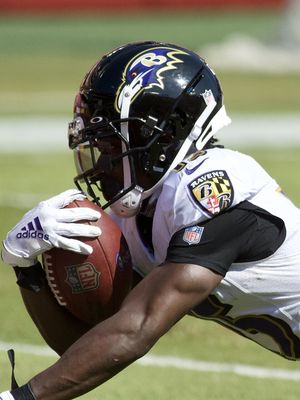 Marquise BrownWRCoaches-1; Media-1
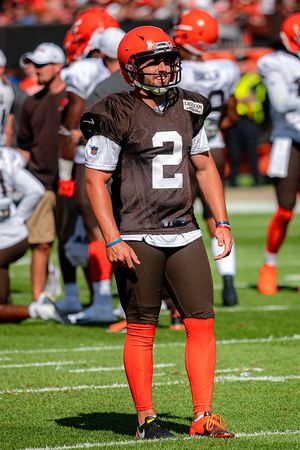 Austin SeibertKCoaches-1; Media-1
Second team
- Carson MeierFBCoaches-2
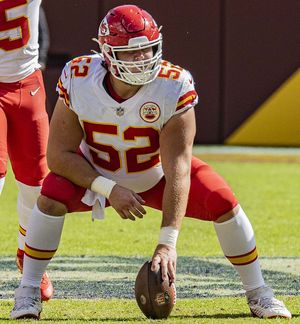 Creed HumphreyCMedia-2
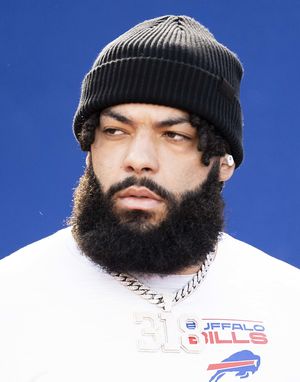 Cody FordOTCoaches-2; Media-2
 Kenneth MurrayLBCoaches-2; Media-2
- Tre BrownAPBCoaches-2
 CeeDee LambAPBMedia-2
From Wikipedia’s 2018 all-conference team article, with the selectors that named each player (AP-1: the Associated Press’s first team).
2018 Big 12 standings
| Team | Conf. | Overall | AP final |
|---|---|---|---|
| Oklahoma | 8–1 | 12–2 | 4 |
| Texas | 7–2 | 10–4 | 9 |
| West Virginia | 6–3 | 8–4 | 20 |
| Iowa State | 6–3 | 8–5 | |
| TCU | 4–5 | 7–6 | |
| Baylor | 4–5 | 7–6 | |
| Oklahoma State | 3–6 | 7–6 | |
| Texas Tech | 3–6 | 5–7 | |
| Kansas State | 3–6 | 5–7 | |
| Kansas | 1–8 | 3–9 |
Ordered by conference winning percentage, then conference wins. Division splits and tiebreakers aren’t applied.