2004 Oklahoma
12–1 (8–0 Big 12), coached by Bob Stoops, finished No. 3 in the AP poll. Share
Schedule and results
- Best winBeat No. 5 Texas 12–0Oct 9
Over the best-ranked team it beat, at a neutral site.
| Date | Opponent | Result | Elo |
|---|---|---|---|
| Sep 4 | vs Bowling Green | W 40–24 | 72% |
| Sep 11 | vs Houston | W 63–13 | 86% |
| Sep 18 | vs Oregon | W 31–7 | 81% |
| Oct 2 | vs Texas Tech | W 28–13 | 73% |
| Oct 9 | vs 5Texas | W 12–0 | 55% |
| Oct 16 | at Kansas State | W 31–21 | 67% |
| Oct 23 | vs Kansas | W 41–10 | 88% |
| Oct 30 | at 20Oklahoma State | W 38–35 | 64% |
| Nov 6 | at 22Texas A&M | W 42–35 | 68% |
| Nov 13 | vs Nebraska | W 30–3 | 85% |
| Nov 20 | at Baylor | W 35–0 | 91% |
| Dec 4 | vs ColoradoBig 12 Championship Game | W 42–3 | 80% |
| Jan 4Bowls & playoff | vs 1USCOrange Bowl | L 19–55 | 48% |
Elo: a pregame chance from scores alone.
How it ended: Lost to USC 55–19 in the Orange Bowl; No. 3 in the final AP poll; Big 12 champions.
In program history: The 13th-best season in program history by end-of-season Elo (of 125 on file).
AP poll, week by week
- Wk 1: 2
- Wk 3: 2
- Wk 4: 2
- Wk 5: 2
- Wk 6: 2
- Wk 7: 2
- Wk 8: 2
- Wk 9: 2
- Wk 10: 2
- Wk 11: 2
- Wk 12: 2
- Wk 13: 2
- Wk 14: 2
- Wk 15: 2
- Final: 3
Big 12 champions8–0 in the conference, won the Big 12 Championship Game
Heisman voteAdrian Peterson, second; Jason White, third
Maxwell AwardJason White, QB; also the Davey O’Brien and Unitas Golden Arm
Outland TrophyJammal Brown, OT
2 consensus All-AmericansAdrian Peterson, RB; Jammal Brown, OT
- Record
- 12–1
- Conference
- 8–0 first in Big 12
- AP final
- No. 3 peak No. 2
- Points
- 452–219
- Coach
- Bob Stoops
- Elo
- 1802 +109 this season
- SP+ rating
- 28.8 No. 2 of 120; offense No. 7, defense No. 10
- SRS
- 21.4 No. 4 of 119 in Division I-A
- Recruiting class
- No. 8
- Offensive coordinators
- Chuck Long and Kevin Wilson
- Defensive coordinators
- Brent Venables and Bo Pelini
- Captains
- Vince Carter, Mark Clayton, Dan Cody, Lance Mitchell and Jason White
- Offense
- Spread
- Defense
- 4–3
How good, play by play
| EPA per play | Success | Explosiveness | FBS rank | |
|---|---|---|---|---|
| Offense | 0.04 | 40% | 1.04 | 17th of 118 |
| Defense | -0.10 | 31% | 1.05 | 26th of 118 |
How these are measured
Play-weighted averages over games against FBS opponents; raw numbers, not adjusted for the strength of the opponent. EPA (expected points added) measures how much each play changed the expected score; success rate counts plays that kept the offense on schedule; explosiveness is the average EPA on successful plays. Lower is better on defense. Ranked by EPA per play among teams that were FBS that season.
Drives and havoc
| Points per trip inside the 40 | Average start | Havoc | |
|---|---|---|---|
| Offense | 0.0 | own 34 | 3% allowed |
| Defense | -0.1 | own 24 | 2% caused |
A trip inside the 40 is a drive that reaches the opponent’s 40-yard line; points per trip is how many it scored on average (allowed, on defense). Average start is where drives began (the defense’s line is where its opponents started). Havoc is the share of plays ending in a tackle for loss, a forced fumble, an interception or a pass broken up. From CollegeFootballData.com.
Top recruits in the 2004 class
| Adrian Peterson RB | ★★★★★ | No. 1 |
| Rhett Bomar PRO | ★★★★★ | No. 4 |
| Chris Patterson OLB | ★★★★★ | No. 28 |
| Marcus Walker CB | ★★★★★ | No. 40 |
| Brandon Braxton OT | ★★★★ | No. 47 |
| D.J. Wolfe RB | ★★★★ | No. 78 |
| Lendy Holmes WR | ★★★★ | No. 117 |
247Sports composite rankings via CollegeFootballData.com; national rank in the class.
The 2004 class by position
| Signed | Stars | Rating | |
|---|---|---|---|
| Quarterbacks | 1 | 5.0 | 0.998 |
| Running backs | 2 | 4.5 | 0.985 |
| Receivers | 1 | 4.0 | 0.936 |
| Offensive line | 1 | 4.0 | 0.979 |
| Linebackers | 1 | 5.0 | 0.988 |
| Defensive backs | 1 | 5.0 | 0.984 |
| Whole class | 7 | 4.6 | 0.979 |
High-school signees by position group, with their average stars and 247Sports composite rating (out of 1), via CollegeFootballData.com. Athletes are signees with no set position.
Drafted in 2005
The 2005 draft| Rd 1 | Jammal Brown OT | New Orleans Saints |
| Rd 1 | Mark Clayton WR | Baltimore Ravens |
| Rd 2 | Brodney Pool DB | Cleveland Browns |
| Rd 2 | Mark Bradley WR | Chicago Bears |
| Rd 2 | Dan Cody LB | Baltimore Ravens |
| Rd 3 | Brandon Jones WR | Tennessee Titans |
| Rd 4 | Antonio Perkins DB | Cleveland Browns |
| Rd 5 | Donte Nicholson DB | Tampa Bay Buccaneers |
| Rd 5 | Michael Hawkins DB | Green Bay Packers |
| Rd 5 | Lance Mitchell LB | Arizona Cardinals |
| Rd 6 | Wes Sims OG | San Diego Chargers |
All-Big 12
10 first team, 2 second teamFirst team
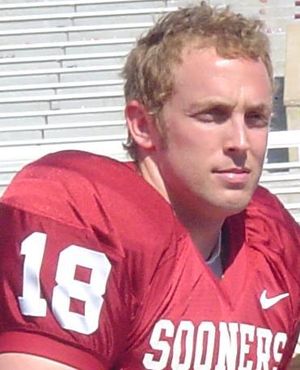 Jason WhiteQBCoaches-1; Media-1
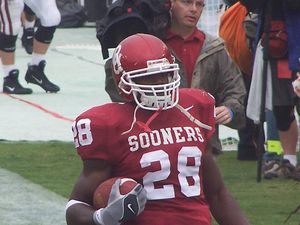 Adrian PetersonRBCoaches-1; Media-1
 Vince CarterCCoaches-1; Media-1
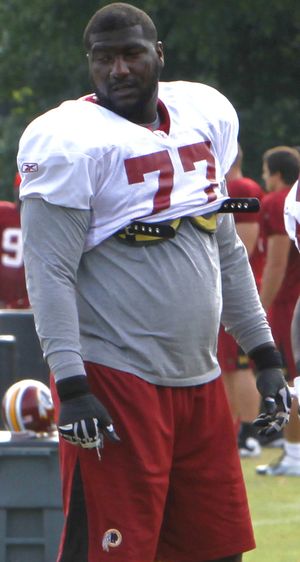 Jammal BrownOTCoaches-1; Media-1
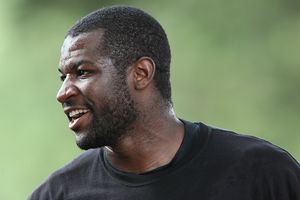 Mark ClaytonWRCoaches-1; Media-1
- Dan CodyDLCoaches-1; Media-1
- Jonathan JacksonDLCoaches-2; Media-1
- Lance MitchellLBCoaches-1; Media-1
- Donte NicholsonDBCoaches-1
- Brodney PoolDBCoaches-2; Media-1
Second team
- Davin JosephOGMedia-2
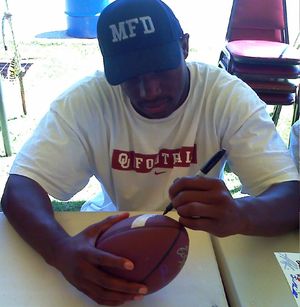 Rufus AlexanderLBMedia-2
From Wikipedia’s 2004 all-conference team article, with the selectors that named each player (AP-1: the Associated Press’s first team).
2004 Big 12 standings
| Team | Conf. | Overall | AP final |
|---|---|---|---|
| Oklahoma | 8–0 | 12–1 | 3 |
| Texas | 7–1 | 11–1 | 5 |
| Texas Tech | 5–3 | 8–4 | 18 |
| Texas A&M | 5–3 | 7–5 | |
| Colorado | 4–4 | 8–5 | |
| Oklahoma State | 4–4 | 7–5 | |
 Iowa State | 4–4 | 7–5 | |
| Nebraska | 3–5 | 5–6 | |
 Missouri | 3–5 | 5–6 | |
| Kansas State | 2–6 | 4–7 | |
| Kansas | 2–6 | 4–7 | |
| Baylor | 1–7 | 3–8 |
Ordered by conference winning percentage, then conference wins. Division splits and tiebreakers aren’t applied.