2025 Notre Dame
10–2, coached by Marcus Freeman, finished No. 10 in the AP poll. Share
Schedule and results
- Best winBeat No. 20 USC 34–24Oct 18
Over the best-ranked team it beat, at home.
- Most excitingLost to No. 16 Texas A&M 40–41Sep 13
The win probability swung the most, by CollegeFootballData.com’s excitement index.
| Date | Opponent | Result | Elo |
|---|---|---|---|
| Aug 31 | at 10Miami | L 24–27 | 59% |
| Sep 13 | vs 16Texas A&M | L 40–41 | 72% |
| Sep 20 | vs Purdue | W 56–30 | 87% |
| Sep 27 | at Arkansas | W 56–13 | 62% |
| Oct 4 | vs Boise State | W 28–7 | 70% |
| Oct 11 | vs NC State | W 36–7 | 83% |
| Oct 18 | vs 20USC | W 34–24 | 71% |
| Nov 1 | at Boston College | W 25–10 | 87% |
| Nov 8 | vs Navy | W 49–10 | 79% |
| Nov 15 | at 23Pittsburgh | W 37–15 | 68% |
| Nov 22 | vs Syracuse | W 70–7 | 92% |
| Nov 29 | at Stanford | W 49–20 | 88% |
Elo: a pregame chance from scores alone.
How it ended: Beat Stanford 49–20; No. 10 in the final AP poll.
In program history: The 5th-best season in program history by end-of-season Elo (of 131 on file).
AP poll, week by week
- Wk 1: 6
- Wk 2: 9
- Wk 3: 8
- Wk 4: 24
- Wk 5: 22
- Wk 6: 21
- Wk 7: 16
- Wk 8: 13
- Wk 9: 12
- Wk 10: 12
- Wk 11: 10
- Wk 12: 9
- Wk 13: 9
- Wk 14: 9
- Wk 15: 9
- Wk 16: 9
- Final: 10
Heisman voteJeremiyah Love, third
Led the nationJadarian Price: kickoff return average (37.5)
Doak Walker AwardJeremiyah Love, RB
2 consensus All-AmericansJeremiyah Love, RB; Leonard Moore, DB
- Record
- 10–2
- Conference
- —
- AP final
- No. 10 peak No. 6
- Points
- 504–211
- Coach
- Marcus Freeman
- Elo
- 1821 +99 this season
- SP+ rating
- 24.4 No. 5 of 136; offense No. 4, defense No. 13, special teams No. 41
- SRS
- 24.1 No. 3 of 136 in FBS
- Returning
- 37% of last season’s EPA, No. 66 of 134
- Recruiting class
- No. 12 roster talent No. 9 in FBS
- Offensive coordinator
- Mike Denbrock
- Defensive coordinator
- Chris Ash
- Captains
- Drayk Bowen, Donovan Hinish, Will Pauling, Billy Schrauth, Adon Shuler and Aamil Wagner
- Most valuable player
- Jeremiyah Love
- Offense
- Multiple
- Defense
- 4–2–5
How good, play by play
| EPA per play | Success | Explosiveness | FBS rank | |
|---|---|---|---|---|
| Offense | 0.27 | 46% | 1.51 | 7th of 136 |
| Defense | -0.08 | 36% | 1.25 | 4th of 136 |
| Opponent-adjusted | 0.25 off -0.09 def | 48% off 35% def | — | 9th off 5th def |
Passing and running
| Pass success | Depth of target | Deep throws | Line yards | Stuffed | |
|---|---|---|---|---|---|
| Offense | 51% | 9.5 yds | 18% | 3.10 | 18% |
| Defense | 38% | 7.3 yds | 10% | 2.90 | 18% |
How these are measured
Play-weighted averages over games against FBS opponents; raw numbers, not adjusted for the strength of the opponent. EPA (expected points added) measures how much each play changed the expected score; success rate counts plays that kept the offense on schedule; explosiveness is the average EPA on successful plays. Lower is better on defense. Ranked by EPA per play among teams that were FBS that season. The opponent-adjusted row (offense / defense) is CollegeFootballData.com’s WEPA, which accounts for who each team played. Passing and running: depth of target is how far downfield passes traveled in the air; deep throws are the share thrown deep, of the passes whose depth and direction the play-by-play describes (about half); line yards are the running yards per carry credited to the blockers; stuffed is the share of carries stopped at or behind the line. The defense’s line is what its opponents did. From CollegeFootballData.com, 2025 on.
Drives and havoc
| Points per trip inside the 40 | Average start | Havoc | |
|---|---|---|---|
| Offense | 4.8 | own 33 | 13% allowed |
| Defense | 2.6 | own 26 | 18% caused |
CORE rating 32.5, 4th of 136 (offense 16.2, defense -16.4).
A trip inside the 40 is a drive that reaches the opponent’s 40-yard line; points per trip is how many it scored on average (allowed, on defense). Average start is where drives began (the defense’s line is where its opponents started). Havoc is the share of plays ending in a tackle for loss, a forced fumble, an interception or a pass broken up. CORE is CollegeFootballData.com’s context- and opponent-adjusted rating (points better than an average team; lower is better on defense). From CollegeFootballData.com.
Leaders
| Passing yards | C.J. Carr QB | 2,741 yds |
| Passing touchdowns | C.J. Carr QB | 24 TD |
| Rushing yards | Jeremiyah Love RB | 1,372 yds |
| Rushing touchdowns | Jeremiyah Love RB | 18 TD |
| Receiving yards | Jordan Faison WR | 640 yds |
| Receiving touchdowns | Will Pauling WR | 6 TD |
| Tackles | Drayk Bowen LB | 67 tkl |
| Sacks | Boubacar Traore DL | 6.5 sacks |
| Interceptions | Leonard Moore CB | 5 INT |
Top recruits in the 2025 class
| Will Black OT | ★★★★★ | No. 26 |
| Madden Faraimo LB | ★★★★ | No. 66 |
| Christopher Burgess Jr. DL | ★★★★ | No. 70 |
| Dallas Golden ATH | ★★★★ | No. 92 |
| James Flanigan TE | ★★★★ | No. 127 |
| JaDon Blair S | ★★★★ | No. 155 |
| Mark Zackery IV CB | ★★★★ | No. 181 |
| Owen Strebig OT | ★★★★ | No. 216 |
247Sports composite rankings via CollegeFootballData.com; national rank in the class.
The 2025 class by position
| Signed | Stars | Rating | |
|---|---|---|---|
| Quarterbacks | 1 | 4.0 | 0.897 |
| Running backs | 1 | 4.0 | 0.905 |
| Receivers | 3 | 3.7 | 0.903 |
| Offensive line | 4 | 4.3 | 0.925 |
| Defensive line | 5 | 3.2 | 0.899 |
| Linebackers | 3 | 3.7 | 0.922 |
| Defensive backs | 5 | 3.4 | 0.904 |
| Athletes and specialists | 3 | 3.7 | 0.893 |
| Whole class | 25 | 3.6 | 0.907 |
High-school signees by position group, with their average stars and 247Sports composite rating (out of 1), via CollegeFootballData.com. Athletes are signees with no set position.
Drafted in 2026
The 2026 draft| Rd 1 | Jeremiyah Love RB | Arizona Cardinals |
| Rd 1 | Jadarian Price RB | Seattle Seahawks |
| Rd 3 | Malachi Fields WR | New York Giants |
| Rd 3 | Eli Raridon TE | New England Patriots |
| Rd 5 | Billy Schrauth OG | Tampa Bay Buccaneers |
| Rd 6 | Gabriel Rubio DT | Pittsburgh Steelers |
Roster 114
The 2025 roster114 players, with numbers, heights, hometowns and each player’s 2025 line; 74 have a stat line. See the roster
Transfers in 8
The 2025 portal Malachi Fields WR | ★★★★ | from  Virginia |
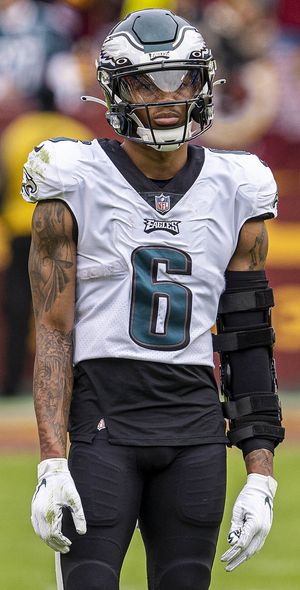 DeVonta Smith S | ★★★ | from  Alabama |
 Jalen Stroman S | ★★★ | from  Virginia Tech |
 Jared Dawson DL | ★★★ | from  Louisville |
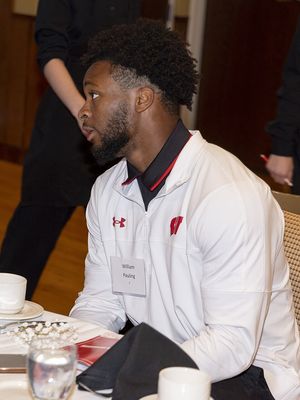 Will Pauling WR | ★★★ | from  Wisconsin |
| Elijah Hughes DL | ★★★ | from  USC |
| Ty Washington TE | ★★★ | from  Arkansas |
 Noah Burnette K | from  North Carolina |
Transfers out 14
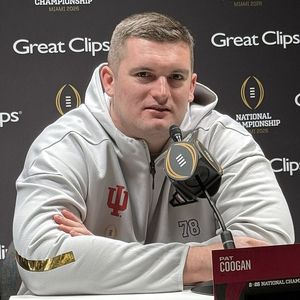 Pat Coogan OL | ★★★★ | to  Indiana |
 Rocco Spindler OL | ★★★★ | to  Nebraska |
| Sam Pendleton OL | ★★★★ | to  Tennessee |
| Steven Angeli QB | ★★★ | to  Syracuse |
| Kennedy Urlacher S | ★★★ | to USC |
| Jaden Mickey CB | ★★★ | to  Boise State |
| Jayden Thomas WR | ★★★ | to Virginia |
| Ty Chan OT | ★★★ | to  UConn |
| Deion Colzie WR | ★★★ | to  Miami (OH) |
| Tyson Ford DL | ★★★ | to  California |
| Aiden Gobaira DE | ★★★ | to  James Madison |
| Rino Monteforte LS | ★★ | to California |
And 2 more, lower-rated or unrated.