Monmouth Hawks
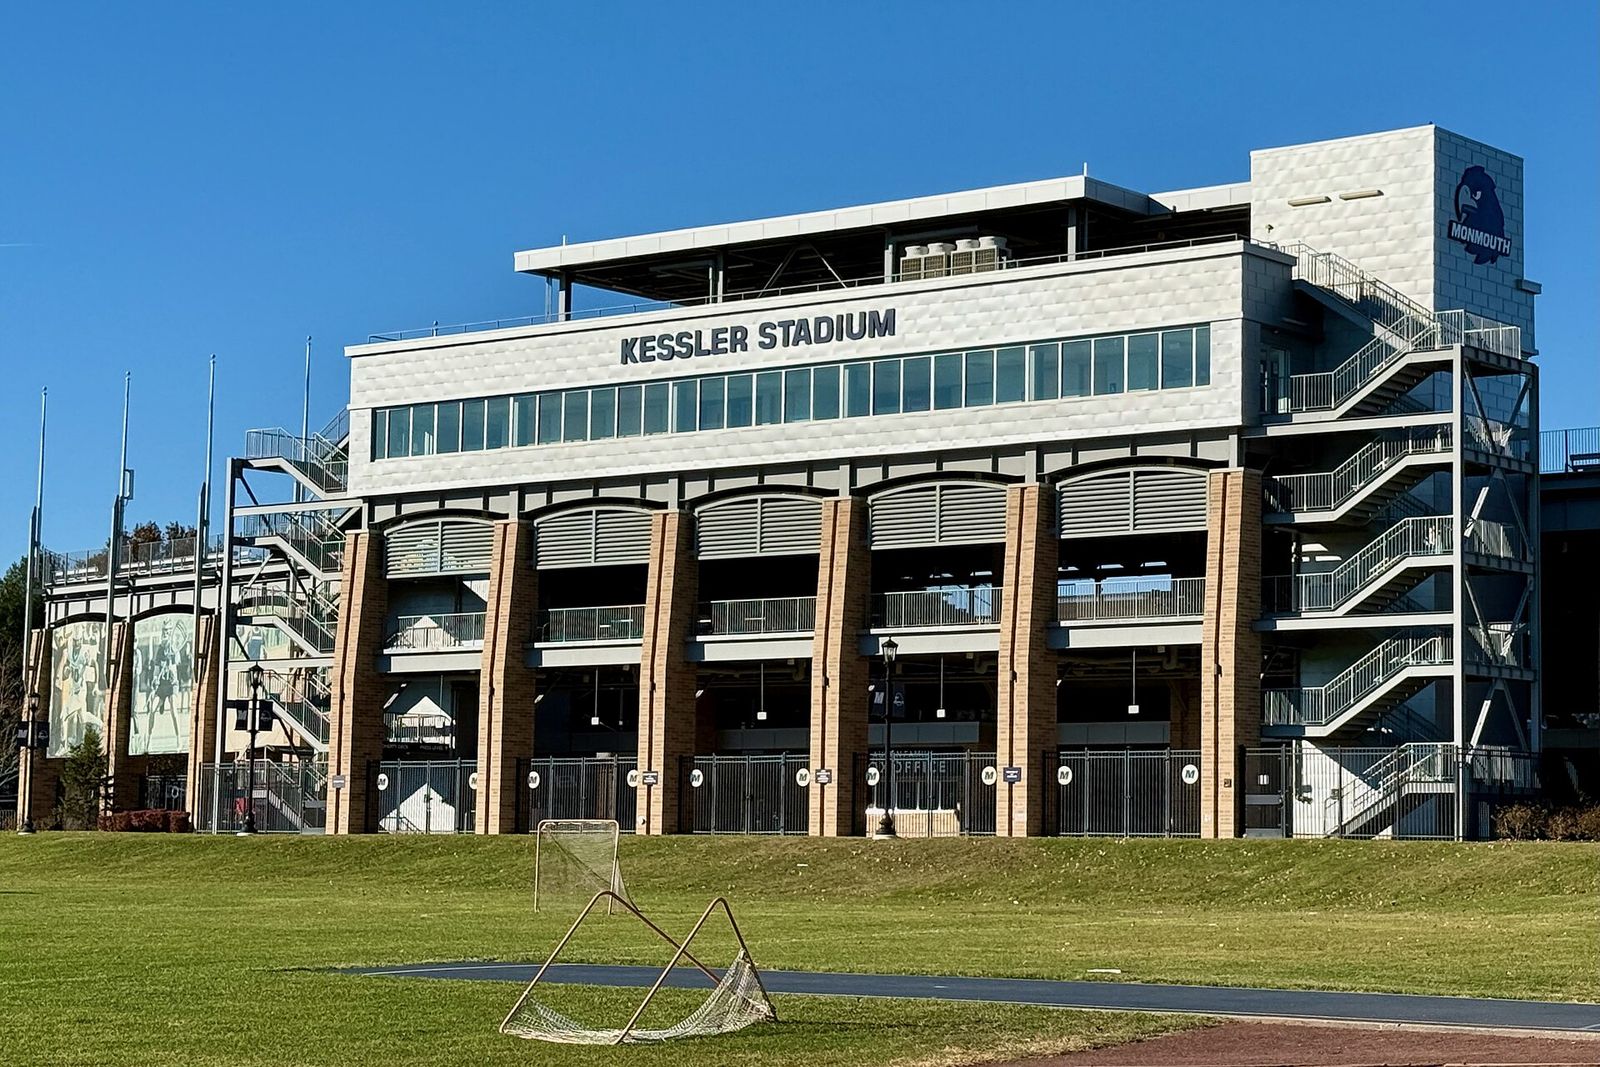
Coastal AthleticWest Long Branch, NJKessler Stadium
2026: 5–2 (4–0 Coastal Athletic). Last: won at New Hampshire 42–21. Next: at Hampton, Saturday, Oct 24, 2 p.m. ET.
- L 14–38at Tennessee Tech
- W 31–24Sacred Heart
- L 14–49at Western Michigan
- W 28–20at UAlbany
- W 31–28at Dartmouth
- W 41–40Towson
- W 42–21at New Hampshire
- Oct 24at Hampton
- Oct 31Bryant
- Nov 7North Carolina A&T
- Nov 14Merrimack
- Nov 21at Campbell
Monmouth has played football since 1993 and is officially 197–151; 259 of its 348 games are in our file. They have won five Northeast Conference titles (the last in 2006) and two Big South Conference titles, counting shared titles. This season, they’re 5–2.
Résumé
- All-time record
- 197–151 official; 152–107 on file; how we count
- Postseason
- 0–0 bowls, title games, playoff
- AP No. 1 finishes
- 0
- Weeks at No. 1
- 0 of 0 ranked
- Elo now
- 1399
- Computer rankings
- Massey No. 26 · Composite No. 28 in FCS, Oct 17; up 7 since Oct 11. From Massey Ratings
- Conference titles
- 7 last in 2020
- Bowl record
- 1–1 official, bowls only
- Seasons
- 24 since 2003, 259 games
2026 season 5–2
RosterFull 2026 season| Date | Opponent | Result | Elo |
|---|---|---|---|
| Aug 29 | at Tennessee Tech | L 14–38 | 37% |
| Sep 5 | vs Sacred Heart | W 31–24 | 62% |
| Sep 12 | at Western Michigan | L 14–49 | 17% |
| Sep 19 | at UAlbany | W 28–20 | 50% |
| Sep 26 | at Dartmouth | W 31–28 | 43% |
| Oct 3 | vs Towson | W 41–40 | 75% |
| Oct 17 | at New Hampshire | W 42–21 | 56% |
| Oct 24 | at Hampton | Preview | 83% |
| Oct 31 | vs Bryant | Preview | 74% |
| Nov 7 | vs North Carolina A&T | Preview | 84% |
| Nov 14 | vs Merrimack | Preview | 79% |
| Nov 21 | at Campbell | Preview | 52% |
Elo: a pregame chance from scores alone.
This season, game by game
On the 2026 team
- Frankie Weaver1,615 passing yards, 13 TD (leads Monmouth in passing yards)
- Kenny Smith602 rushing yards, 6 TD (leads Monmouth in rushing yards)
- Elijah Jennings573 rushing yards, 3 TD
- Tra Neal36 catches, 549 yards, 4 TD (leads Monmouth in receiving yards)
- Jaeden Jones60 tackles, 2 INT (leads Monmouth in tackles)
- Gavin Nelson41 catches, 440 yards, 4 TD (leads Monmouth in receiving touchdowns)
Program strength since 2003
Best seasons everMost-played series
All rivalries- UAlbany
7–9 in 16
- 2009 L 10–35
- 2010 L 19–28
- 2011 L 24–41
- 2012 L 24–55
- 2017 L 14–28
- 2019 W 38–35
- 2022 W 38–31
- 2023 L 0–41
- 2025 L 24–31
- 2026 W 28–20
Won the last one.
- Wagner
10–5 in 15
- 2008 W 31–17
- 2009 L 24–27
- 2010 L 20–31
- 2011 L 29–44
- 2012 W 38–17
- 2013 W 23–6
- 2014 W 21–16
- 2015 W 31–16
- 2018 W 54–47
- 2019 W 16–14
Won the last six.
- Robert Morris
9–4 in 13
- 2006 W 16–7
- 2007 L 17–20
- 2008 W 34–26
- 2009 L 9–23
- 2010 L 16–17
- 2011 L 20–23
- 2012 W 26–21
- 2013 W 35–9
- 2014 W 51–20
- 2021 W 44–7
Won the last four.
| Opponent | Games | MONM record |
|---|---|---|
| UAlbany | 16 | 7–9 |
| Wagner | 15 | 10–5 |
| Robert Morris | 13 | 9–4 |
| Sacred Heart | 12 | 10–2 |
| Saint Francis | 11 | 8–3 |
| Central Connecticut | 9 | 5–4 |
| Bryant | 9 | 8–1 |
| Lehigh | 9 | 5–4 |
Every opponent (73)
Every program Monmouth has played, A to Z, with Monmouth’s record against it. Each links to the series, game by game.
- Bryant 8–1
- Bucknell 2–0
- California (PA) 1–0
- Campbell 3–1
- Central Connecticut 5–4
- Central Michigan 0–1
- Charleston Southern 5–3
- Charlotte 0–1
- Chicago 0–8
- Coastal Carolina 0–5
- Coe 1–0
- Colgate 2–3
- Columbia 2–0
- Cornell 1–1
- Dartmouth 1–0
- Delaware 0–3
- Delaware State 3–0
- Drake 0–1
- Duquesne 4–4
- Eastern Michigan 0–1
- Eastern Washington 0–1
- Elon 0–1
- Florida Atlantic 0–1
- Florida International 1–0
- Fordham 5–2
- Gardner-Webb 7–1
- Georgetown 3–0
- Hampton 5–0
- Holy Cross 3–2
- Howard 1–0
- Illinois 0–2
- Iona 2–0
- Iowa 0–4
- James Madison 0–1
- Kennesaw State 2–5
- Kent State 0–1
- Knox 2–2
- La Salle 3–0
- Lafayette 3–2
- Lehigh 5–4
- Liberty 2–3
- Lombard 0–1
- Maine 1–4
- Middle Tennessee 0–1
- Missouri 0–2
- Montana 0–1
- Montana State 0–1
- Morgan State 1–0
- New Hampshire 1–4
- North Alabama 2–0
- North Carolina A&T 2–0
- Northern Iowa 0–1
- Northwestern 0–2
- Old Dominion 1–1
- Presbyterian 4–2
- Princeton 0–2
- Purdue 0–1
- Rhode Island 1–3
- Rhodes 0–1
- Robert Morris 9–4
- Sacred Heart 10–2
- Saint Francis 8–3
- Sam Houston 0–1
- San Diego 0–1
- St. Peter’s 3–0
- Stony Brook 6–3
- Tennessee Tech 0–1
- Towson 3–2
- UAlbany 7–9
- Villanova 4–0
- Wagner 10–5
- Western Michigan 0–2
- William & Mary 0–1
Conference titles
7, counting shared titlesAs the program counts them in its Wikipedia article, shared titles included, and listed under each conference’s current name (a Western Conference title of the 1900s counts as a Big Ten title); season pages use the name the conference had that year. A title the article files under a conference the team wasn’t in that season is listed under the one it was. Division titles include years the team tied for its division.
Conferences
- Independent 1993–1995
- NEC 1996–2012
- Independent 2013
- Big South 2014–2021
- CAA 2022
- Coastal Athletic Conference since 2023
- 2013Went independent from the NEC in football, announced February 14, 2013. Source
- 2014Joined the Big South from independence in football, announced February 14, 2013. Source
- 2022Joined the CAA from the Big South in football, announced January 25, 2022. Source
Monmouth’s football conferences by season, from CollegeFootballData.com’s memberships (renamed conferences keep the name of the time). The moves and their announcement dates from Wikipedia’s lists of NCAA Division I conference changes; the year is the first season in the new conference. Conference realignment: Wikipedia (CC BY-SA).
In the NFL Draft
By college- Drafted, rounds 1–7
- 2 since 2009
- First-round picks
- 0
The school
Monmouth University- Enrollment
- 4,767 3,710 undergraduates, fall 2024
- Where
- West Long Branch, New Jersey
- Public or private
- Private nonprofit
- Founded
- 1933
- Graduates’ median earnings
- $67,991 10 years after starting
Enrollment, place and Carnegie research tier from the National Center for Education Statistics (IPEDS, public domain). Earnings from the US Department of Education’s College Scorecard (CC BY 4.0): the median for students who received federal aid and were working, not in school. Founding year from Wikidata. Every school’s in the data.
Season by season
National champions| Season | Record | Conf. | AP pre | AP final | Coach | Elo | SP+ |
|---|---|---|---|---|---|---|---|
| 2026 | 5–2 | 4–0 | 1399 | ||||
| 2025 | 9–3 | 6–2 | 1374 | ||||
| 2024 | 6–6 | 4–3 | 1333 | ||||
| 2023 | 4–7 | 3–5 | 1280 | ||||
| 2022 | 5–6 | 3–5 | 1325 | ||||
| 2021 | 7–4 | 6–1 | 1437 | ||||
| 2020 | 3–1 | 1471 | |||||
| 2019 | 11–3 | 7–0 | 1486 | ||||
| 2018 | 8–3 | 4–1 | 1404 | ||||
| 2017 | 9–3 | 4–1 | 1379 | ||||
| 2016 | 4–7 | 0–5 | 1236 | ||||
| 2015 | 5–6 | 3–3 | 1326 | ||||
| 2014 | 6–5 | 1–4 | 1320 | ||||
| 2013 | 6–6 | 1310 | |||||
| 2012 | 4–5 | 3–3 | 1273 | ||||
| 2011 | 5–6 | 4–4 | 1264 | ||||
| 2010 | 3–8 | 3–5 | 1268 | ||||
| 2009 | 5–6 | 4–4 | 1316 | ||||
| 2008 | 7–5 | 7–1 | 1390 | ||||
| 2007 | 4–6 | 3–3 | 1354 | ||||
| 2006 | 10–2 | 6–1 | 1449 | ||||
| 2005 | 6–4 | 4–3 | 1383 | ||||
| 2004 | 10–1 | 6–1 | 1435 | ||||
| 2003 | 10–2 | 6–1 | 1367 |
Officially 197–151 since 1993 (per Wikipedia, rechecked weekly); game by game here, 152–107 (259 of its 348 games are on file). Our file starts in 2003; the program began in 1993. Some games are missing from our source.
Records are computed from every game on file at CollegeFootballData.com, whose coverage of the earliest seasons can be incomplete. Elo is this site’s own rating; see how it works on the records page.