
Lindenwood Lions
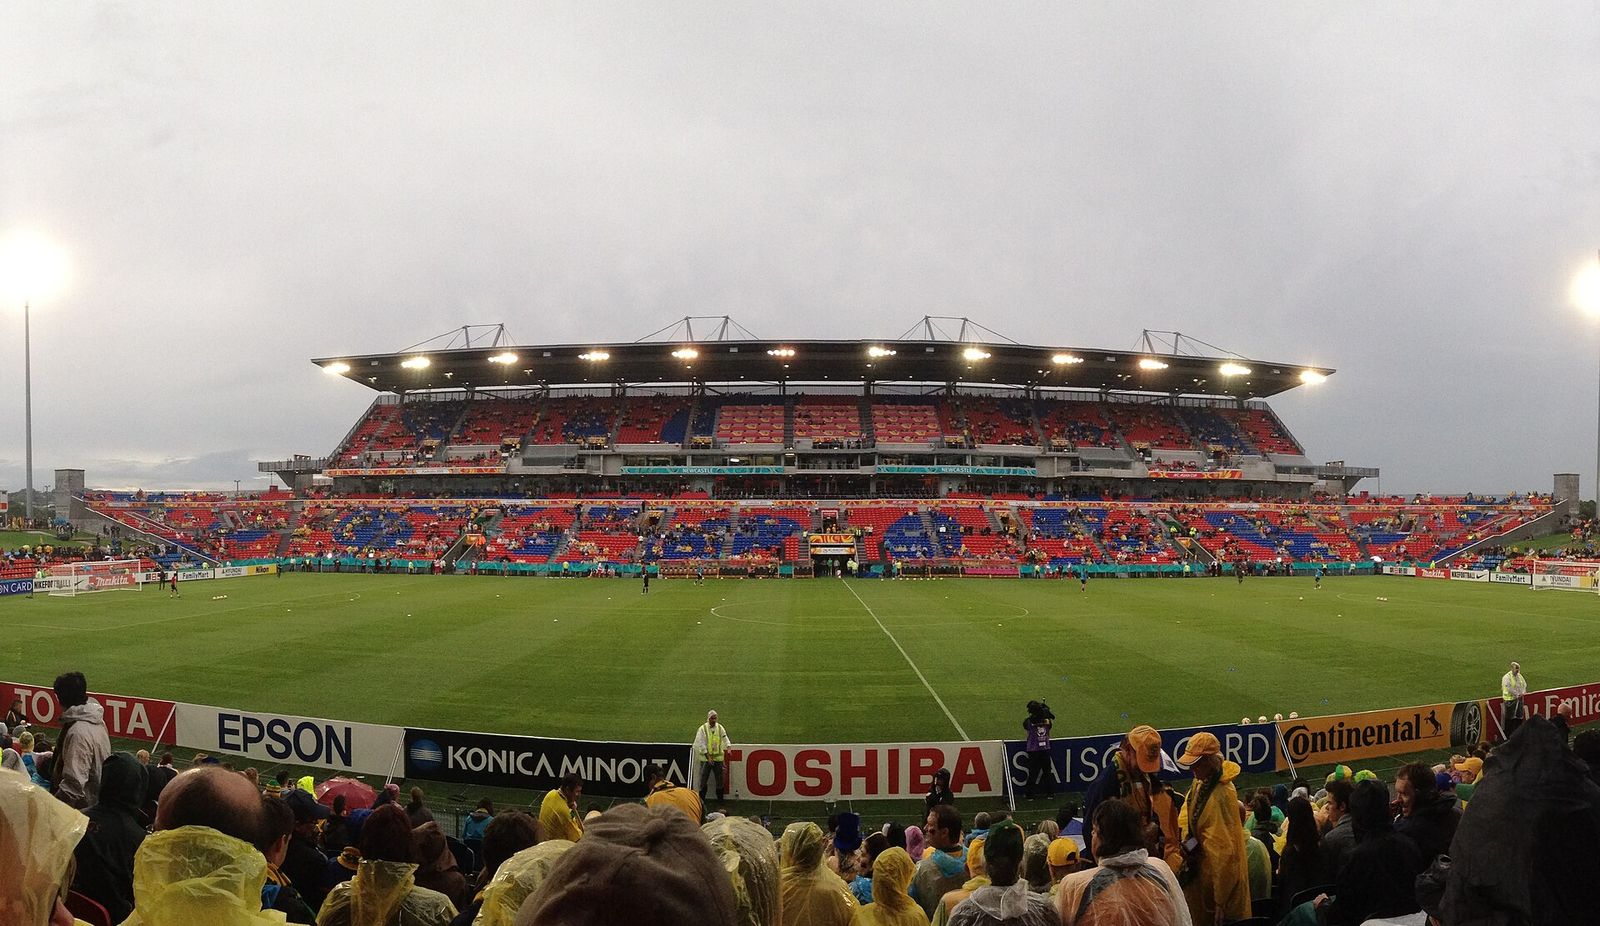
OVCSaint Charles, MOHunter Stadium
2026: 2–4 (2–1 OVC). Last: won at Eastern Illinois 20–13. Next: Chicago State, Saturday, Oct 24, 3 p.m. ET.
- W 20–17Charleston Southern
- L 32–36at Stony Brook
- L 14–48at Missouri State
- L 3–29at Eastern Michigan
- L 27–38Southeast Missouri State
- W 20–13at Eastern Illinois
- Oct 24Chicago State
- Oct 31Tennessee State
- Nov 7at Gardner-Webb
- Nov 14at UT Martin
- Nov 21Western Illinois
Lindenwood has played football since 1990 and is officially 192–195–2; 65 of its 389 games are in our file. They have won three Heart of America Athletic Conference titles (the last in 2009) and two Great Lakes Valley Conference titles, counting shared titles. This season, they’re 2–4.
Résumé
- All-time record
- 192–195–2 official; 33–32 on file; how we count
- Postseason
- 0–0 bowls, title games, playoff
- AP No. 1 finishes
- 0
- Weeks at No. 1
- 0 of 0 ranked
- Elo now
- 1256
- Computer rankings
- Massey No. 63 · Composite No. 87 in FCS, Oct 17; up 11 since Oct 11. From Massey Ratings
- Conference titles
- 5 last in 2021
- Bowl record
- 5–7 official, bowls only
- Seasons
- 8 since 2011, 65 games
2026 season 2–4
RosterFull 2026 season| Date | Opponent | Result | Elo |
|---|---|---|---|
| Aug 27 | vs Charleston Southern | W 20–17 | 67% |
| Sep 3 | at Stony Brook | L 32–36 | 44% |
| Sep 12 | at Missouri State | L 14–48 | 27% |
| Sep 26 | at Eastern Michigan | L 3–29 | 30% |
| Oct 10 | vs Southeast Missouri State | L 27–38 | 58% |
| Oct 17 | at Eastern Illinois | W 20–13 | 43% |
| Oct 24 | vs Chicago State | Preview | 72% |
| Oct 31 | vs Tennessee State | Preview | 67% |
| Nov 7 | at Gardner-Webb | Preview | 42% |
| Nov 14 | at UT Martin | Preview | 33% |
| Nov 21 | vs Western Illinois | Preview | 60% |
Elo: a pregame chance from scores alone.
This season, game by game
On the 2026 team
- Pops Battle877 passing yards, 2 TD (leads Lindenwood in passing yards)
- Jared Rhodes318 rushing yards, 2 TD (leads Lindenwood in rushing yards)
- Caleb Jacobmeier34 tackles, 1 sack, 1 INT (leads Lindenwood in tackles)
- Drew Krobath19 catches, 249 yards, 1 TD (leads Lindenwood in receiving yards)
- Jalen Smith17 catches, 236 yards
- Brayon Crawford28 tackles
Program strength since 2011
Best seasons everMost-played series
All rivalries- Eastern Illinois
4–1 in 5
Won the last three.
- Southeast Missouri State
2–3 in 5
Lost the last one.
| Opponent | Games | LIN record |
|---|---|---|
| Eastern Illinois | 5 | 4–1 |
| Southeast Missouri State | 5 | 2–3 |
Every opponent (38)
Every program Lindenwood has played, A to Z, with Lindenwood’s record against it. Each links to the series, game by game.
- Angelo State 0–1
- App State 0–1
- Austin Peay 0–1
- Bryant 0–1
- Central Arkansas 1–1
- Charleston Southern 3–1
- Eastern Illinois 4–1
- Eastern Michigan 0–1
- Eastern Washington 0–1
- Findlay 1–0
- Gardner-Webb 0–2
- Grand Valley State 0–1
- Houston Christian 1–0
- Illinois State 0–1
- Indianapolis 1–0
- Kansas 0–1
- Keiser University 1–0
- Kentucky Wesleyan 1–0
- McKendree 2–0
- Miami (OH) 0–1
- Missouri S&T 1–0
- Missouri State 0–2
- Murray State 1–0
- Northern Colorado 1–0
- Quincy 1–0
- South Dakota 0–1
- South Dakota State 0–1
- Southeast Missouri State 2–3
- Southwest Baptist 1–0
- St. Thomas (MN) 1–1
- Stony Brook 1–1
- Tennessee State 1–2
- Tennessee Tech 1–3
- Truman State 1–0
- UT Martin 1–2
- Western Illinois 2–1
- William Jewell 2–0
- Wisconsin Stevens Point 1–0
Conference titles
5, counting shared titles- Heart of America Athletic Conference 3
- 2004, 2007, 2009
As the program counts them in its Wikipedia article, shared titles included, and listed under each conference’s current name (a Western Conference title of the 1900s counts as a Big Ten title); season pages use the name the conference had that year. A title the article files under a conference the team wasn’t in that season is listed under the one it was. Division titles include years the team tied for its division.
Conferences
- Independent 2011
- Mid America Conference 2012–2018
- Great Lakes Valley Conference 2019 and 2021
- OVC 2022
- Big South-OVC 2023–2024
- OVC-Big South 2025
- OVC since 2026
- 2022Joined the OVC from the Great Lakes Valley Conference, announced February 23, 2022. Source
- 2026Joined the OVC from the OVC-Big South in football, announced June 18, 2026. Source
Lindenwood’s football conferences by season, from CollegeFootballData.com’s memberships (renamed conferences keep the name of the time). The moves and their announcement dates from Wikipedia’s lists of NCAA Division I conference changes; the year is the first season in the new conference. Conference realignment: Wikipedia (CC BY-SA).
In the NFL Draft
By college- Drafted, rounds 1–7
- 1 since 2014
- First-round picks
- 0
The school
Lindenwood University- Enrollment
- 6,826 4,663 undergraduates, fall 2024
- Where
- Saint Charles, Missouri
- Public or private
- Private nonprofit
- Founded
- 1827
- Graduates’ median earnings
- $53,278 10 years after starting
Enrollment, place and Carnegie research tier from the National Center for Education Statistics (IPEDS, public domain). Earnings from the US Department of Education’s College Scorecard (CC BY 4.0): the median for students who received federal aid and were working, not in school. Founding year from Wikidata. Every school’s in the data.
Season by season
National champions| Season | Record | Conf. | AP pre | AP final | Coach | Elo | SP+ |
|---|---|---|---|---|---|---|---|
| 2026 | 2–4 | 2–1 | 1256 | ||||
| 2025 | 6–6 | 5–3 | 1304 | ||||
| 2024 | 5–7 | 4–4 | 1244 | ||||
| 2023 | 3–7 | 1–5 | 1158 | ||||
| 2022 | 7–3 | 2–3 | 1285 | ||||
| 2021 | 9–3 | 1295 | |||||
| 2019 | 0–1 | 1144 | |||||
| 2011 | 1–1 | 1151 |
Officially 192–195–2 since 1990 (per Wikipedia, rechecked weekly); game by game here, 33–32 (65 of its 389 games are on file). Our file starts in 2011; the program began in 1990. Some games are missing from our source.
No season on file for 2012–18, 2020: the program may not have played, or our source may be missing them.
Records are computed from every game on file at CollegeFootballData.com, whose coverage of the earliest seasons can be incomplete. Elo is this site’s own rating; see how it works on the records page.