2021 Kentucky
10–3 (5–3 Southeastern Conference), coached by Mark Stoops, finished No. 18 in the AP poll. Officially 0–3: the NCAA vacated nine regular-season wins and the 2022 Citrus Bowl win. Share
From the season’s Wikipedia article: “Although the NCAA has not announced the full penalties, it has been indicated by the university that those penalties will include a 2–year probation and vacation of all games in which the ineligible players participated for those two seasons.”
Schedule and results
- Biggest upsetBeat No. 10 Florida 20–13Oct 2
Florida was ranked No. 10 and favored to win.
- Most excitingLost to Tennessee 42–45Nov 6
The win probability swung the most, by CollegeFootballData.com’s excitement index.
| Date | Opponent | Result | Elo |
|---|---|---|---|
| Sep 4 | vs UL Monroe | W 45–10vacated | 82% |
| Sep 11 | vs Missouri | W 35–28vacated | 63% |
| Sep 18 | vs Chattanooga | W 28–23vacated | 86% |
| Sep 25 | at South Carolina | W 16–10vacated | 60% |
| Oct 2 | vs 10Florida | W 20–13vacated | 48% |
| Oct 9 | vs LSU | W 42–21vacated | 61% |
| Oct 16 | at 1Georgia | L 13–30 | 25% |
| Oct 30 | at Mississippi State | L 17–31 | 55% |
| Nov 6 | vs Tennessee | L 42–45 | 69% |
| Nov 13 | at Vanderbilt | W 34–17vacated | 81% |
| Nov 20 | vs New Mexico State | W 56–16vacated | 90% |
| Nov 27 | at Louisville | W 52–21vacated | 47% |
| Jan 1Bowls & playoff | vs 17IowaCitrus Bowl | W 20–17vacated | 45% |
Elo: a pregame chance from scores alone.
How it ended: Beat Iowa 20–17 in the Citrus Bowl; No. 18 in the final AP poll; 4th in the Southeastern Conference.
In program history: The 6th-best season in program history by end-of-season Elo (of 123 on file).
AP poll, week by week
- Wk 6: 16
- Wk 7: 11
- Wk 8: 15
- Wk 9: 12
- Wk 10: 18
- Wk 14: 25
- Wk 15: 25
- Final: 18
- Record
- 10–3
- Conference
- 5–3 4th in Southeastern Conference
- AP final
- No. 18 peak No. 11
- Points
- 420–282
- Coach
- Mark Stoops
- Elo
- 1644 +96 this season
- SP+ rating
- 13.4 No. 23 of 130; offense No. 21, defense No. 35
- SRS
- 9.2 No. 26 of 130 in FBS
- Returning
- 39% of last season’s EPA, No. 116 of 128
- Recruiting class
- No. 32 roster talent No. 30 in FBS
- Offensive coordinator
- Liam Coen
- Defensive coordinators
- Brad White and Jon Sumrall
- Offense
- Multiple pro-style
- Defense
- 3–4 or 4–3
How good, play by play
| EPA per play | Success | Explosiveness | FBS rank | |
|---|---|---|---|---|
| Offense | 0.18 | 50% | 1.11 | 45th of 130 |
| Defense | 0.09 | 44% | 1.18 | 37th of 130 |
| Opponent-adjusted | 0.18 off 0.10 def | 50% off 44% def | — | 44th off 34th def |
How these are measured
Play-weighted averages over games against FBS opponents; raw numbers, not adjusted for the strength of the opponent. EPA (expected points added) measures how much each play changed the expected score; success rate counts plays that kept the offense on schedule; explosiveness is the average EPA on successful plays. Lower is better on defense. Ranked by EPA per play among teams that were FBS that season. The opponent-adjusted row (offense / defense) is CollegeFootballData.com’s WEPA, which accounts for who each team played.
Drives and havoc
| Points per trip inside the 40 | Average start | Havoc | |
|---|---|---|---|
| Offense | 4.9 | own 28 | 15% allowed |
| Defense | 3.6 | own 27 | 18% caused |
CORE rating 6.0, 44th of 130 (offense 3.7, defense -2.3).
A trip inside the 40 is a drive that reaches the opponent’s 40-yard line; points per trip is how many it scored on average (allowed, on defense). Average start is where drives began (the defense’s line is where its opponents started). Havoc is the share of plays ending in a tackle for loss, a forced fumble, an interception or a pass broken up. CORE is CollegeFootballData.com’s context- and opponent-adjusted rating (points better than an average team; lower is better on defense). From CollegeFootballData.com.
Leaders
| Passing yards | Will Levis QB | 2,826 yds |
| Passing touchdowns | Will Levis QB | 24 TD |
| Rushing yards | Chris Rodriguez Jr. RB | 1,379 yds |
| Rushing touchdowns | Chris Rodriguez Jr. RB | 9 TD |
| Receiving yards | Wan’Dale Robinson WR | 1,334 yds |
| Receiving touchdowns | Wan’Dale Robinson WR | 7 TD |
| Tackles | Jacquez Jones LB | 82 tkl |
| Sacks | J.J. Weaver LB | 6.5 sacks |
| Interceptions | J.J. Weaver LB | 2 INT |
Top recruits in the 2021 class
| Jager Burton OL | ★★★★ | No. 139 |
| Trevin Wallace LB | ★★★★ | No. 141 |
| Dekel Crowdus WR | ★★★★ | No. 307 |
| Chris Lewis WR | ★★★★ | No. 342 |
| Jordan Dingle TE | ★★★ | No. 480 |
247Sports composite rankings via CollegeFootballData.com; national rank in the class.
The 2021 class by position
| Signed | Stars | Rating | |
|---|---|---|---|
| Quarterbacks | 1 | 3.0 | 0.860 |
| Receivers | 4 | 3.5 | 0.890 |
| Offensive line | 3 | 3.3 | 0.889 |
| Defensive line | 2 | 3.0 | 0.867 |
| Linebackers | 2 | 3.5 | 0.906 |
| Defensive backs | 4 | 3.0 | 0.863 |
| Athletes and specialists | 2 | 3.0 | 0.827 |
| Whole class | 18 | 3.2 | 0.874 |
High-school signees by position group, with their average stars and 247Sports composite rating (out of 1), via CollegeFootballData.com. Athletes are signees with no set position.
Drafted in 2022
The 2022 draft| Rd 2 | Wan’Dale Robinson WR | New York Giants |
| Rd 2 | Josh Paschal DE | Detroit Lions |
| Rd 3 | Luke Fortner C | Jacksonville Jaguars |
| Rd 5 | Darian Kinnard OG | Kansas City Chiefs |
Roster 125
The 2021 roster125 players, with numbers, heights, hometowns and each player’s 2021 line; 65 have a stat line. See the roster
Transfers in 7
The 2021 portal Wan’Dale Robinson WR | ★★★★ | from  Nebraska |
| Dare Rosenthal OT | ★★★ | from  LSU |
 Jacquez Jones LB | ★★★ | from  Ole Miss |
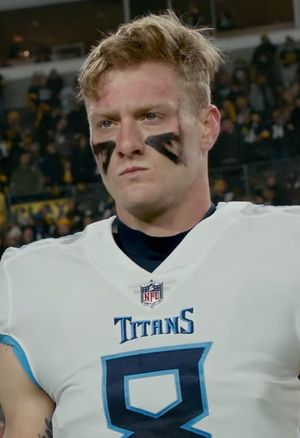 Will Levis QB | ★★★ | from  Penn State |
 Tre’Von Morgan WR | ★★★ | from  Michigan State |
| Luke Fulton LB | ★★★ | from Michigan State |
 Justice Dingle SDE | ★★★ | from  Georgia Tech |
Transfers out 10
 Akeem Hayes WR | ★★★ | to  Arkansas State |
| Allen Dailey WR | ★★★ | to  South Alabama |
| Bryce Oliver WR | ★★★ | no new school on file |
| Jamari Brown CB | ★★★ | no new school on file |
| Jerquavion Mahone DL | ★★★ | to  Temple |
| M.J. Devonshire CB | ★★★ | to  Pittsburgh |
| Nick Lewis OT | ★★★ | to Arkansas State |
| Nik Ognenovic TE | ★★★ | to  Akron |
| Terry Wilson QB | ★★★ | to  New Mexico |
| Johnathan Mosley QB | no new school on file |
All-SEC
4 first team, 1 second teamFirst team
- Chris Rodriguez Jr.RBAP-1; Coaches-2
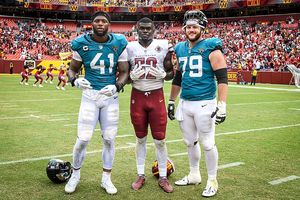 Luke FortnerCCoaches-1
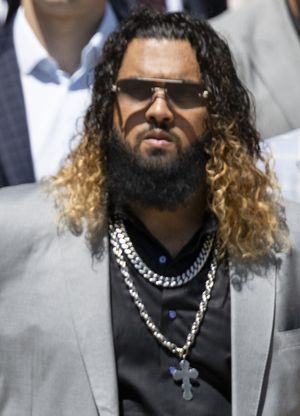 Darian KinnardOLAP-1; Coaches-1
- Josh PaschalDEAP-1; Coaches-2
Second team
- Wan’Dale RobinsonWRAP-2; Coaches-2
From Wikipedia’s 2021 all-conference team article, with the selectors that named each player (AP-1: the Associated Press’s first team).
2021 Southeastern Conference standings
Conference page| Team | Conf. | Overall | AP final |
|---|---|---|---|
| Georgia | 8–0 | 14–1 | 1 |
 Alabama | 7–1 | 13–2 | 2 |
| Ole Miss | 6–2 | 10–3 | 11 |
| Kentucky | 5–3 | 10–3 | 18 |
 Arkansas | 4–4 | 9–4 | 21 |
 Texas A&M | 4–4 | 8–4 | |
| Tennessee | 4–4 | 7–6 | |
| Mississippi State | 4–4 | 7–6 | |
| South Carolina | 3–5 | 7–6 | |
| LSU | 3–5 | 6–7 | |
 Auburn | 3–5 | 6–7 | |
| Missouri | 3–5 | 6–7 | |
| Florida | 2–6 | 6–7 | |
| Vanderbilt | 0–8 | 2–10 |
Ordered by conference winning percentage, then conference wins. Division splits and tiebreakers aren’t applied.