
2003 Hawai’i
9–5 (5–3 Western Athletic Conference), coached by June Jones. Share
Schedule and results
- Biggest winBeat Army 59–28Nov 22
By 31 points, its widest win.
| Date | Opponent | Result | Elo |
|---|---|---|---|
| Aug 31 | vs App State | W 40–17 | 85% |
| Sep 13 | at 4USC | L 32–61 | 21% |
| Sep 19 | at UNLV | L 22–33 | 49% |
| Sep 28 | vs Rice | W 41–21 | 75% |
| Oct 4 | at Tulsa | L 16–27 | 66% |
| Oct 12 | vs Fresno State | W 55–28 | 53% |
| Oct 18 | at Louisiana Tech | W 44–41 | 56% |
| Oct 26 | vs UTEP | W 31–15 | 87% |
| Nov 1 | at San José State | W 13–10 | 65% |
| Nov 15 | at Nevada | L 14–24 | 62% |
| Nov 22 | vs Army | W 59–28 | 91% |
| Nov 29 | vs Alabama | W 37–29 | 56% |
| Dec 6 | vs 18Boise State | L 28–45 | 32% |
| Dec 25Bowls & playoff | vs HoustonHawai’i Bowl | W 54–48 | 62% |
Elo: a pregame chance from scores alone.
How it ended: Beat Houston 54–48 in the Hawai’i Bowl; unranked in the final AP poll; tied for 4th in the Western Athletic Conference.
In program history: The 12th-best season in program history by end-of-season Elo (of 97 on file).
Players on this team
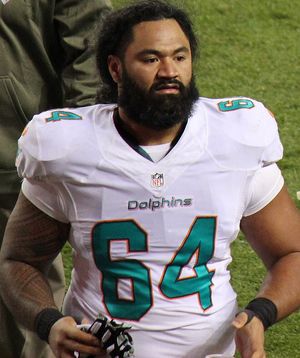
Before 2004 our records hold honors and the draft; these are the players whose college years here, from their Wikipedia articles or their honors, include 2003.
- Record
- 9–5
- Conference
- 5–3 tied for 4th in Western Athletic Conference
- AP final
- Unranked
- Points
- 486–427
- Coach
- June Jones
- Elo
- 1547 −1 this season
- SP+ rating
- -0.7 No. 63 of 117; offense No. 19, defense No. 99
- SRS
- −1.6 No. 67 of 117 in Division I-A
- Recruiting class
- No. 82
- Defensive coordinator
- George Lumpkin
- Offense
- Run and shoot
- Defense
- 4–3
Drives and havoc
| Points per trip inside the 40 | Average start | Havoc | |
|---|---|---|---|
| Offense | 0.0 | own 24 | — allowed |
| Defense | 0.0 | own 42 | — caused |
A trip inside the 40 is a drive that reaches the opponent’s 40-yard line; points per trip is how many it scored on average (allowed, on defense). Average start is where drives began (the defense’s line is where its opponents started). Havoc is the share of plays ending in a tackle for loss, a forced fumble, an interception or a pass broken up. From CollegeFootballData.com.
Top recruits in the 2003 class
| Ray Bass CB | ★★ | No. 1050 |
| Jeremy Inferrera OG | ★★ | No. 1050 |
| Tu Tui S | ★★ | No. 1050 |
| Xavier Ho’olulu OT | ★★ | No. 1050 |
| Larry Sauafea OT | ★★ | No. 1050 |
247Sports composite rankings via CollegeFootballData.com; national rank in the class.
The 2003 class by position
| Signed | Stars | Rating | |
|---|---|---|---|
| Quarterbacks | 1 | 2.0 | 0.767 |
| Receivers | 1 | 2.0 | 0.767 |
| Offensive line | 4 | 2.0 | 0.767 |
| Defensive line | 2 | 2.0 | 0.767 |
| Defensive backs | 6 | 2.0 | 0.767 |
| Whole class | 14 | 2.0 | 0.767 |
High-school signees by position group, with their average stars and 247Sports composite rating (out of 1), via CollegeFootballData.com. Athletes are signees with no set position.
Drafted in 2004
The 2004 draft| Rd 2 | Travis LaBoy DE | Tennessee Titans |
| Rd 4 | Isaac Sopoaga DT | San Francisco 49ers |
2003 Western Athletic Conference standings
| Team | Conf. | Overall | AP final |
|---|---|---|---|
| Boise State | 8–0 | 13–1 | 16 |
| Fresno State | 6–2 | 9–5 | |
| Tulsa | 6–2 | 8–5 | |
 Hawai’i | 5–3 | 9–5 | |
| Rice | 5–3 | 5–7 | |
| Nevada | 4–4 | 6–6 | |
| Louisiana Tech | 3–5 | 5–7 | |
| San José State | 2–6 | 3–8 | |
| UTEP | 1–7 | 2–11 | |
 SMU | 0–8 | 0–12 |
Ordered by conference winning percentage, then conference wins. Division splits and tiebreakers aren’t applied.