2026 California
3–4 (2–2 Atlantic Coast Conference), coached by Tosh Lupoi. The season’s Wikipedia article records 3–3, over six games to the seven on file here. Share
Schedule and results
- Biggest winBeat Wagner 49–7Sep 19
By 42 points, its widest win.
- Most excitingBeat Virginia Tech 25–20Oct 10
The win probability swung the most, by CollegeFootballData.com’s excitement index.
| Date | Opponent | Result | Elo |
|---|---|---|---|
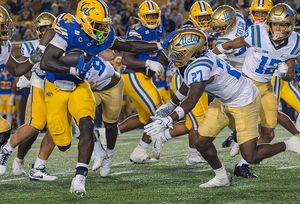
| Sep 5 | vs UCLA | L 24–45 | 62% |
| Sep 12 | at Syracuse | W 21–18 | 41% |
| Sep 19 | vs Wagner | W 49–7 | 86% |
| Sep 25 | vs Clemson | L 10–24 | 42% |
| Oct 3 | at UNLV | L 31–39 | 27% |
| Oct 10 | vs Virginia Tech | W 25–20 | 46% |
| Oct 17 | vs 21Wake Forest | L 7–41 | 35% |
| Oct 24 | at SMU | Preview | 16% |
| Oct 31 | at NC State | Preview | 29% |
| Nov 14 | at Virginia | Preview | 28% |
| Nov 21 | vs Stanford | Preview | 56% |
| Nov 28 | vs Pittsburgh | Preview | 40% |
Elo: a pregame chance from scores alone.
- Record
- 3–4
- Conference
- 2–2 tied for 7th in Atlantic Coast Conference
- AP now
- Unranked
- Points
- 167–194
- Coach
- Tosh Lupoi
- Elo
- 1430 −51 this season
- SP+ rating
- -2.5 No. 87 of 138; offense No. 90, defense No. 76, special teams No. 123
- SRS
- −4.0 No. 86 of 138 in FBS
- Returning
- 58% of last season’s EPA, No. 43 of 136
- Recruiting class
- No. 56 roster talent No. 33 in FBS
- Offensive coordinators
- Jordan Somerville and Ike Hilliard
- Defensive coordinators
- Michael Hutchings and Da’Von Brown
- Offense
- Pro-style
- Defense
- Multiple 3–4
How good, play by play
| EPA per play | Success | Explosiveness | FBS rank | |
|---|---|---|---|---|
| Offense | -0.10 | 35% | 1.22 | 131st of 138 |
| Defense | 0.17 | 40% | 1.47 | 97th of 138 |
| Opponent-adjusted | 0.01 off 0.11 def | 38% off 39% def | — | 123rd off 72nd def |
Passing and running
| Pass success | Depth of target | Deep throws | Line yards | Stuffed | |
|---|---|---|---|---|---|
| Offense | 40% | 6.3 yds | 9% | 2.50 | 21% |
| Defense | 39% | 8.2 yds | 16% | 3.10 | 14% |
How these are measured
Play-weighted averages over games against FBS opponents; raw numbers, not adjusted for the strength of the opponent. EPA (expected points added) measures how much each play changed the expected score; success rate counts plays that kept the offense on schedule; explosiveness is the average EPA on successful plays. Lower is better on defense. Ranked by EPA per play among teams that were FBS that season. The opponent-adjusted row (offense / defense) is CollegeFootballData.com’s WEPA, which accounts for who each team played. Passing and running: depth of target is how far downfield passes traveled in the air; deep throws are the share thrown deep, of the passes whose depth and direction the play-by-play describes (about half); line yards are the running yards per carry credited to the blockers; stuffed is the share of carries stopped at or behind the line. The defense’s line is what its opponents did. From CollegeFootballData.com, 2025 on.
Drives and havoc
| Points per trip inside the 40 | Average start | Havoc | |
|---|---|---|---|
| Offense | 2.6 | own 27 | 18% allowed |
| Defense | 3.5 | own 31 | 13% caused |
CORE rating -11.0, 108th of 138 (offense -9.2, defense 1.7).
A trip inside the 40 is a drive that reaches the opponent’s 40-yard line; points per trip is how many it scored on average (allowed, on defense). Average start is where drives began (the defense’s line is where its opponents started). Havoc is the share of plays ending in a tackle for loss, a forced fumble, an interception or a pass broken up. CORE is CollegeFootballData.com’s context- and opponent-adjusted rating (points better than an average team; lower is better on defense). From CollegeFootballData.com.
Leaders
| Passing yards | Jaron-Keawe Sagapolutele QB | 1,290 yds |
| Passing touchdowns | Jaron-Keawe Sagapolutele QB | 9 TD |
| Rushing yards | Adam Mohammed RB | 336 yds |
| Rushing touchdowns | Ashten Emory RB | 4 TD |
| Receiving yards | Chase Hendricks WR | 415 yds |
| Receiving touchdowns | Carson Perry-Smith RB | 2 TD |
| Tackles | Isaiah Crosby DB | 38 tkl |
| Sacks | A.J. Tuitele LB | 3 sacks |
| Interceptions | Kingston Lopa DB | 5 INT |
Top recruits in the 2026 class
| Daniel McMorris OT | ★★★★ | No. 267 |
| Taimane Purcell TE | ★★★★ | No. 357 |
| Victor Santino RB | ★★★ | No. 527 |
| E.J. Morgan WR | ★★★ | No. 554 |
| Nainoa Lopes QB | ★★★ | No. 704 |
247Sports composite rankings via CollegeFootballData.com; national rank in the class.
The 2026 class by position
| Signed | Stars | Rating | |
|---|---|---|---|
| Quarterbacks | 1 | 3.0 | 0.881 |
| Running backs | 1 | 3.0 | 0.888 |
| Receivers | 3 | 3.3 | 0.887 |
| Offensive line | 5 | 3.2 | 0.876 |
| Defensive line | 4 | 3.0 | 0.860 |
| Linebackers | 2 | 3.0 | 0.877 |
| Athletes and specialists | 2 | 3.0 | 0.868 |
| Whole class | 18 | 3.1 | 0.874 |
High-school signees by position group, with their average stars and 247Sports composite rating (out of 1), via CollegeFootballData.com. Athletes are signees with no set position.
Roster 112
The 2026 roster112 players, with numbers, heights, hometowns and each player’s 2026 line; 64 have a stat line. See the roster
Transfers in 32
The 2026 portal Chase Hendricks WR | ★★★★ | from  Ohio |
 Adam Mohammed RB | ★★★★ | from  Washington |
 Ian Strong WR | ★★★★ | from  Rutgers |
 Dorian Thomas TE | ★★★★ | from  New Mexico |
 Jericho Johnson DL | ★★★★ | from  Oregon |
| Kingston Lopa S | ★★★★ | from Oregon |
 Daniel Harris CB | ★★★ | from  Georgia |
 Michael Hurst S | ★★★ | from  Northern Arizona |
 Rickey Fletcher CB | ★★★ | from  Ole Miss |
| Cooper Perry WR | ★★★ | from Oregon |
 Justin Beadles DE | ★★★ | from  Louisville |
 Kahlee Tafai OT | ★★★ | from  Minnesota |
And 20 more, lower-rated or unrated.
Transfers out 36
 Cade Uluave LB | ★★★★ | to  BYU |
| Kendrick Raphael RB | ★★★★ | to  SMU |
| Luke Ferrelli LB | ★★★★ | to Ole Miss |
| Leon Bell OT | ★★★ | to  Colorado |
| Braden Miller OT | ★★★ | to  Duke |
| Cameron Sidney S | ★★★ | returned to  California |
| Landon Morris TE | ★★★ | to  Wake Forest |
| T.J. Bush DE | ★★★ | to Minnesota |
| Brandon High RB | ★★★ | to  UTSA |
| Harrison Taggart LB | ★★★ | to  Utah State |
| Jaiven Plummer WR | ★★★ | to  Georgia Tech |
| Nick Morrow OT | ★★★ | to  Kansas |
And 24 more, lower-rated or unrated.
2026 Atlantic Coast Conference standings
Conference page| Team | Conf. | Overall | AP final |
|---|---|---|---|
 Miami | 4–0 | 6–0 | |
| Wake Forest | 4–1 | 6–1 | |
| SMU | 3–1 | 5–1 | |
 North Carolina | 2–1 | 4–2 | |
| Clemson | 2–1 | 4–2 | |
| Louisville | 3–2 | 4–3 | |
| Virginia Tech | 2–2 | 5–2 | |
| Pittsburgh | 2–2 | 5–2 | |
| Virginia | 2–2 | 4–3 | |
| California | 2–2 | 3–4 | |
 Duke | 1–2 | 4–2 | |
| NC State | 1–2 | 3–3 | |
 Boston College | 1–2 | 3–3 | |
 Georgia Tech | 1–2 | 2–4 | |
 Florida State | 1–3 | 3–4 | |
| Stanford | 1–3 | 3–4 | |
| Syracuse | 0–4 | 2–4 |
Ordered by conference winning percentage, then conference wins. Division splits and tiebreakers aren’t applied.