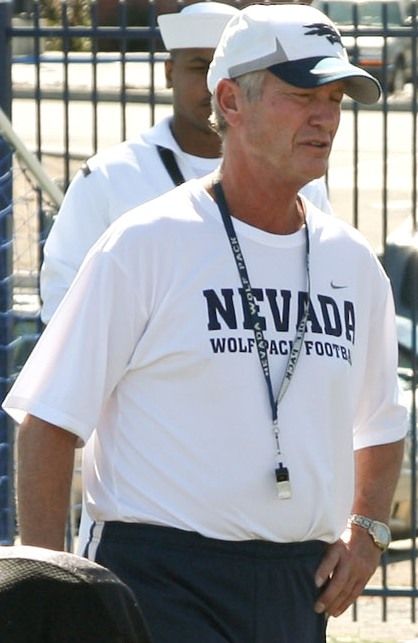

Chris Ault
Chris Ault went 234–108–1 as a head coach, 1976–2012, at Nevada. Share
16 seasons our game records don’t credit to him come from the coach’s Wikipedia article: 1976–91 at Nevada (on file under another coach). They’re marked in the table.
- Record
- 234–108–1 career
- Seasons
- 28
- Schools
- 1
- Final AP top 10
- 0 seasons
- Hall of Fame
- 2002 inducted
- Best season
- 2010 13–1, No. 11
Season by season
| Season | School | Record | Conference finish | Bowl | AP final | |
|---|---|---|---|---|---|---|
| 1976 | Nevada * | 8–3 | ||||
| 1977 | Nevada * | 8–3 | ||||
| 1978 | Nevada * | 11–1 | NCAA Division I-AA Semifinal L | |||
| 1979 | Nevada * | 8–4 | 2nd | NCAA Division I-AA Semifinal L | ||
| 1980 | Nevada * | 6–4–1 | T–2nd | |||
| 1981 | Nevada * | 7–4 | T–4th | |||
| 1982 | Nevada * | 6–5 | T–5th | |||
| 1983 | Nevada * | 10–4 | 1st | NCAA Division I-AA Semifinal L | ||
| 1984 | Nevada * | 7–4 | 2nd | |||
| 1985 | Nevada * | 11–2 | 2nd | NCAA Division I-AA Quarterfinal L | ||
| 1986 | Nevada * | 13–1 | 1st | NCAA Division I-AA Semifinal L | ||
| 1987 | Nevada * | 5–6 | T–4th | |||
| 1988 | Nevada * | 7–4 | T–4th | |||
| 1989 | Nevada * | 7–4 | T–3rd | |||
| 1990 | Nevada * | 13–2 | 1st | NCAA Division I-AA Championship L | ||
| 1991 | Nevada * | 12–1 | 1st | NCAA Division I-AA Quarterfinal L | ||
| 1992 | Nevada | 7–5 | 1st | Las Vegas Bowl L | ||
| 1993: not a college head coach | ||||||
| 1994 | Nevada | 9–2 | T–1st | |||
| 1995 | Nevada | 9–3 | 1st | Las Vegas Bowl L | ||
| 1996–03: not a college head coach | ||||||
| 2004 | Nevada | 5–7 | T–6th | |||
| 2005 | Nevada | 9–3 | T–1st | Hawai’i Bowl W | ||
| 2006 | Nevada | 8–5 | T–3rd | MPC Computers Bowl L | ||
| 2007 | Nevada | 6–7 | T–4th | New Mexico Bowl L | ||
| 2008 | Nevada | 7–6 | T–2nd | Humanitarian Bowl L | ||
| 2009 | Nevada | 8–5 | 2nd | Hawai’i Bowl L | ||
| 2010 | Nevada | 13–1 | T–1st | Fight Hunger Bowl W | 11 | |
| 2011 | Nevada | 7–6 | T–2nd | Hawai’i Bowl L | ||
| 2012 | Nevada | 7–6 | 5th | New Mexico Bowl L | ||
Each season links to the team’s season page; bowls and playoff games link to the game. Conference finishes from the Wikipedia article’s record table. * A season our game records don’t credit to him; its record is the article’s.
How his teams did
| Kind of game | Games | Record | Won |
|---|---|---|---|
| Against ranked teams | 17 | 2–15 | 12% |
| Against top-10 teams | 6 | 1–5 | 17% |
| Against rivals | 43 | 26–17 | 60% |
| Conference games | 91 | 65–26 | 71% |
| Bowls and playoffs | 10 | 2–8 | 20% |
| Decided by 8 points or fewer | 53 | 27–26 | 51% |
| At home | 73 | 57–16 | 78% |
| On the road | 68 | 36–32 | 53% |
| At neutral sites | 10 | 2–8 | 20% |
| As our Elo’s favorite | 105 | 83–22 | 79% |
| As our Elo’s underdog | 46 | 12–34 | 26% |
His own 151 games on file, 1992–2012, as played (vacated wins counted, ties as half a win). Ranks are the AP poll going into the game; rivals are the ones either program’s Wikipedia article names; favorite and underdog by our own Elo rating, which reads only scores.
Against other head coaches
| Coach | Record | Their schools | Games | |
|---|---|---|---|---|
| Pat Hill 2004–2011 | 5–3 | Fresno State | 8 | |
| Chris Petersen 2006–2012 | 1–6 | Boise State | 7 | |
| Mike Sanford Sr. 2005–2009 | 5–0 | UNLV | 5 | |
| Robb Akey 2007–2011 | 5–0 | Idaho | 5 | |
| Dick Tomey 2005–2009 | 4–1 | San José State | 5 | |
| June Jones 2004–2009 | 1–4 | Hawai’i, SMU | 5 | |
| Brent Guy 2005–2008 | 4–0 | Utah State | 4 | |
| Hal Mumme 2005–2008 | 3–1 | New Mexico State | 4 | |
| Greg McMackin 2008–2011 | 2–2 | Hawai’i | 4 | |
| Gary Pinkel 1995–2009 | 0–4 | Toledo, Missouri | 4 |
Chris Ault’s record against the head coaches he met three or more times, from the games on file, as played.
Most-faced opponents
| Opponent | Games | Record |
|---|---|---|
| UNLVseries | 12 | 10–2 |
| San José Stateseries | 11 | 9–2 |
| New Mexico Stateseries | 10 | 9–1 |
| Utah Stateseries | 10 | 9–1 |
| Fresno Stateseries | 10 | 6–4 |
| Boise Stateseries | 10 | 1–9 |
| Louisiana Techseries | 9 | 7–2 |
| Hawai’iseries | 9 | 4–5 |
Career
| Years | Team | Job | |
|---|---|---|---|
| 1968 | Churchill County HS (NV) high school | Assistant coach | |
| 1969–71 | Bishop Manogue HS (NV) high school | Head coach | |
| 1972 | Reno HS (NV) high school | Head coach | |
| 1973–75 | UNLV | Assistant coach | |
| 1976–92 | Nevada | Head coach | |
| 1994–95 | Nevada | Head coach | |
| 2004–12 | Nevada | Head coach | |
| 2016–17 | Rhinos Milano | Head coach |
Every job as the infobox of his Wikipedia article lists it (CC BY-SA), assistant jobs included.
Coaching tree
Worked under
- Ron MeyerUNLV
Assistants who became head coaches
- John SmithUtah State, Louisville, Michigan State, Arkansas, Idaho, Kentucky State
- Jeff TisdelNevada, Sacramento City, Sierra
- Jeff WoodruffEastern Michigan
- Jeff HortonNevada, UNLV, Minnesota
- Ken WilsonNevada
- Steve HagenWartburg
- Bobby PetrinoLouisville, Arkansas, Western Kentucky, Atlanta Falcons, Missouri State
- Tim DeRuyterTexas A&M, Fresno State
- Nigel BurtonPortland State
- Donte WilliamsUSC
- Nick RolovichHawai’i, Washington State, California
Coached under him, later head coaches (11)
| Coach | With him | Head coach at | |
|---|---|---|---|
| John Smith | Nevada, 1977–81: defensive coordinator | Utah State, Louisville, Michigan State, Arkansas, Idaho, Kentucky State | |
| Jeff Tisdel | Nevada, 1978: graduate assistant; 1988: assistant coach; 1994–95: assistant head coach | Nevada, Sacramento City, Sierra | |
| Jeff Woodruff | Nevada, 1983: defensive backs coach | Eastern Michigan | |
| Jeff Horton | Nevada, 1985–89: wide receivers, running backs and special teams coach; 1992: wide receivers coach | Nevada, UNLV, Minnesota | |
| Ken Wilson | Nevada, 1989–90: outside linebackers and defensive ends coach; 1991–92, 1994–95: inside linebackers coach; 2004–06, 2008–09, 2012: assistant head coach and linebackers coach; 2007: defensive coordinator and safeties coach; 2010–11: assistant head coach and defensive ends coach | Nevada | |
| Steve Hagen | Nevada, 1992: offensive coordinator and quarterbacks coach | Wartburg | |
| Bobby Petrino | Nevada, 1994: offensive coordinator and quarterbacks coach | Louisville, Arkansas, Western Kentucky, Atlanta Falcons, Missouri State | |
| Tim DeRuyter | Nevada, 2005–06: co-defensive coordinator and safeties coach | Texas A&M, Fresno State | |
| Nigel Burton | Nevada, 2008–09: defensive coordinator | Portland State | |
| Donte Williams | Nevada, 2010: defensive quality control coach | USC | |
| Nick Rolovich | Nevada, 2012: offensive coordinator and quarterbacks coach | Hawai’i, Washington State, California |
Other assistants under him (11)
| Coach | With him | |
|---|---|---|
| Bill Miller | Nevada, 1983–85: defensive coordinator | |
| Don Dunn | Nevada, 1994: co-defensive coordinator | |
| Steve Caldwell | Nevada, 1994: co-defensive coordinator | |
| Mike Gillhamer | Nevada, 1995: defensive coordinator | |
| Barry Sacks | Nevada, 2004–06: co-defensive coordinator | |
| Chris Klenakis | Nevada, 2004–09: offensive coordinator | |
| Dave Fipp | Nevada, 2004: co-defensive coordinator | |
| Derek Sage | Nevada, 2004: graduate assistant | |
| Kim McCloud | Nevada, 2004: wide receivers coach; 2005–07: cornerbacks coach | |
| Andy Buh | Nevada, 2010–11: defensive coordinator | |
| Mike Bradeson | Nevada, 2012: defensive coordinator |
From coaches’ Wikipedia infoboxes (CC BY-SA) and each season’s article for its coordinators: an assistant’s seasons at a school count under its head coach in our records; jobs in the NFL and elsewhere, under the head coach whose own article lists the job that year. Names without a page here link to their Wikipedia articles.
How he coached
Ault’s teams went for it on 24% of fourth downs and on 35% of those where the model said go for it, passed on 41% of plays and took 24.2 seconds a play, 2004–2012.
| Season | Went for it on fourth | When the model said go | Pass rate | Seconds a play | EPA a play | |
|---|---|---|---|---|---|---|
| 2004 1 g | 1 of 10 10% | 0% | 61% | 19.7 | −0.08 | |
| 2005 5 g | 4 of 36 11% | 21% | 47% | 25.4 | +0.10 | |
| 2006 6 g | 6 of 46 13% | 14% | 44% | 29.0 | −0.13 | |
| 2007 12 g | 21 of 97 22% | 33% | 44% | 24.7 | +0.11 | |
| 2008 12 g | 25 of 100 25% | 30% | 44% | 24.8 | +0.07 | |
| 2009 13 g | 18 of 72 25% | 31% | 33% | 24.0 | +0.21 | |
| 2010 14 g | 24 of 74 32% | 53% | 37% | 25.1 | +0.21 | |
| 2011 13 g | 22 of 98 22% | 36% | 41% | 24.0 | +0.06 | |
| 2012 13 g | 28 of 87 32% | 49% | 39% | 20.5 | +0.14 | |
| All 89 g | 149 of 620 24% | 35% | 41% | 24.2 | +0.11 |
His seasons as a head coach from 2004 on, from ESPN’s play by play: fourth downs where he went for it out of every fourth-down decision; how often he went when SportsDataverse’s fourth-down model said going for it was the better call; the share of his offense’s plays that were passes; seconds of game clock per offensive play (lower is faster); and expected points added per offensive play (EPA, a measure of how much each play moved the offense toward points). The season in progress counts its games so far. SportsDataverse’s coach tendencies, from ESPN’s play by play; the EPA and the fourth-down model are SportsDataverse’s.