
2007 Oregon State
9–4 (6–3 Pac-10), coached by Mike Riley, finished No. 25 in the AP poll. Share
Schedule and results
- Biggest upsetBeat No. 2 California 31–28Oct 13
California was ranked No. 2, above it.
| Date | Opponent | Result | Elo |
|---|---|---|---|
| Aug 30 | vs Utah | W 24–7 | 59% |
| Sep 6 | at Cincinnati | L 3–34 | 48% |
| Sep 15 | vs Idaho State | W 61–10 | 90% |
| Sep 22 | at Arizona State | L 32–44 | 40% |
| Sep 29 | vs UCLA | L 14–40 | 53% |
| Oct 6 | vs Arizona | W 31–16 | 58% |
| Oct 13 | at 2California | W 31–28 | 21% |
| Oct 27 | vs Stanford | W 23–6 | 78% |
| Nov 3 | at 13USC | L 3–24 | 21% |
| Nov 10 | vs Washington | W 29–23 | 71% |
| Nov 17 | at Washington State | W 52–17 | 52% |
| Dec 1 | at 18Oregon | W 38–31 | 38% |
| Dec 28Bowls & playoff | vs MarylandEmerald Bowl | W 21–14 | 59% |
Elo: a pregame chance from scores alone.
How it ended: Beat Maryland 21–14 in the Emerald Bowl; No. 25 in the final AP poll; 3rd in the Pac-10.
In program history: The 5th-best season in program history by end-of-season Elo (of 110 on file).
AP poll, week by week
- Final: 25
- Record
- 9–4
- Conference
- 6–3 3rd in Pac-10
- AP final
- No. 25 peak No. 25
- Points
- 362–294
- Coach
- Mike Riley
- Elo
- 1649 +78 this season
- SP+ rating
- 11.6 No. 38 of 120; offense No. 74, defense No. 6, special teams No. 76
- SRS
- 10.0 No. 17 of 119 in FBS
- Recruiting class
- No. 40
- Offensive coordinator
- Danny Langsdorf
- Defensive coordinator
- Mark Banker
- Offense
- Multiple
- Defense
- 4–3
How good, play by play
| EPA per play | Success | Explosiveness | FBS rank | |
|---|---|---|---|---|
| Offense | -0.04 | 38% | 0.79 | 107th of 119 |
| Defense | -0.11 | 32% | 0.96 | 1st of 119 |
How these are measured
Play-weighted averages over games against FBS opponents; raw numbers, not adjusted for the strength of the opponent. EPA (expected points added) measures how much each play changed the expected score; success rate counts plays that kept the offense on schedule; explosiveness is the average EPA on successful plays. Lower is better on defense. Ranked by EPA per play among teams that were FBS that season.
Drives and havoc
| Points per trip inside the 40 | Average start | Havoc | |
|---|---|---|---|
| Offense | -0.2 | own 34 | 2% allowed |
| Defense | -0.1 | own 32 | 3% caused |
A trip inside the 40 is a drive that reaches the opponent’s 40-yard line; points per trip is how many it scored on average (allowed, on defense). Average start is where drives began (the defense’s line is where its opponents started). Havoc is the share of plays ending in a tackle for loss, a forced fumble, an interception or a pass broken up. From CollegeFootballData.com.
Top recruits in the 2007 class
| Cameron Collins S | ★★★ | No. 400 |
| Ahmed Mokhtar RB | ★★★ | No. 768 |
| Anthony Watkins S | ★★★ | No. 816 |
| Keith Pankey OLB | ★★★ | No. 879 |
| Carl Sommer TE | ★★★ | No. 879 |
247Sports composite rankings via CollegeFootballData.com; national rank in the class.
The 2007 class by position
| Signed | Stars | Rating | |
|---|---|---|---|
| Running backs | 1 | 3.0 | 0.843 |
| Receivers | 4 | 2.3 | 0.772 |
| Offensive line | 3 | 2.0 | 0.767 |
| Defensive line | 4 | 2.3 | 0.767 |
| Linebackers | 3 | 3.0 | 0.833 |
| Defensive backs | 5 | 2.8 | 0.826 |
| Whole class | 20 | 2.5 | 0.796 |
High-school signees by position group, with their average stars and 247Sports composite rating (out of 1), via CollegeFootballData.com. Athletes are signees with no set position.
Drafted in 2008
The 2008 draft| Rd 5 | Roy Schuening OG | St. Louis Rams |
| Rd 7 | Joey LaRocque OLB | Chicago Bears |
All-Pac-10
2 first team, 8 second teamFirst team
 Roy SchueningOGCoaches-1
- Dorian SmithDECoaches-1
Second team
- Yvenson BernardRBCoaches-2
- Andy LevitreOTCoaches-2
- Jeff Van OrsowDECoaches-2
- Joey LaRocqueLBCoaches-2
- Alan DarlinLBCoaches-2
- Derrick DoggettLBCoaches-2
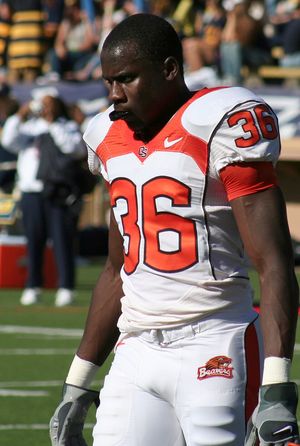 Brandon HughesCBCoaches-2
- Alexis SernaKCoaches-2
From Wikipedia’s 2007 all-conference team article, with the selectors that named each player (AP-1: the Associated Press’s first team).
2007 Pac-10 standings
| Team | Conf. | Overall | AP final |
|---|---|---|---|
| USC | 7–2 | 11–2 | 3 |
| Arizona State | 7–2 | 10–3 | 16 |
| Oregon State | 6–3 | 9–4 | 25 |
| Oregon | 5–4 | 9–4 | 23 |
| UCLA | 5–4 | 6–7 | |
| Arizona | 4–5 | 5–7 | |
| California | 3–6 | 7–6 | |
| Washington State | 3–6 | 5–7 | |
| Stanford | 3–6 | 4–8 | |
| Washington | 2–7 | 4–9 |
Ordered by conference winning percentage, then conference wins. Division splits and tiebreakers aren’t applied.