
2002 Oregon State
8–5 (4–4 Pac-10), coached by Dennis Erickson. Share
Schedule and results
- Biggest winBeat Fresno State 59–19Sep 21
By 40 points, its widest win.
| Date | Opponent | Result | Elo |
|---|---|---|---|
| Aug 29 | vs Eastern Kentucky | W 49–10 | 87% |
| Sep 5 | at Temple | W 35–3 | 61% |
| Sep 14 | vs UNLV | W 47–17 | 73% |
| Sep 21 | vs Fresno State | W 59–19 | 63% |
| Sep 28 | at 18USC | L 0–22 | 49% |
| Oct 5 | vs UCLA | L 35–43 | 61% |
| Oct 12 | at Arizona State | L 9–13 | 48% |
| Oct 26 | vs California | W 24–13 | 65% |
| Nov 2 | vs Arizona | W 38–3 | 74% |
| Nov 9 | at Washington | L 29–41 | 53% |
| Nov 16 | at Stanford | W 31–21 | 57% |
| Nov 23 | vs Oregon | W 45–24 | 56% |
| Dec 26Bowls & playoff | vs 25PittsburghInsight Bowl | L 13–38 | 47% |
Elo: a pregame chance from scores alone.
How it ended: Lost to Pittsburgh 38–13 in the Insight Bowl; unranked in the final AP poll; tied for 4th in the Pac-10.
In program history: The 21st-best season in program history by end-of-season Elo (of 110 on file).
AP poll, week by week
- Wk 6: 23
Players on this team
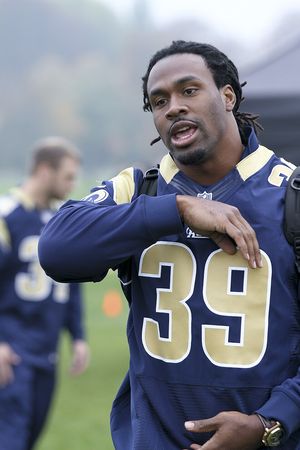 Steven JacksonRunning back
 James LeeDefensive tackle
- Derek AndersonQuarterback
- Tim EuhusTight end
- Adam KoetsOffensive tackle
- Joe NewtonReceiver
Before 2004 our records hold honors and the draft; these are the players whose college years here, from their Wikipedia articles or their honors, include 2002.
- Record
- 8–5
- Conference
- 4–4 tied for 4th in Pac-10
- AP final
- Unranked peak No. 23
- Points
- 414–267
- Coach
- Dennis Erickson
- Elo
- 1586 +28 this season
- SP+ rating
- 13.4 No. 30 of 117; offense No. 30, defense No. 32
- SRS
- 13.5 No. 18 of 117 in Division I-A
- Recruiting class
- No. 45
- Offensive coordinator
- Tim Lappano
- Defensive coordinator
- Craig Bray
- Captains
- Nick Barnett, Eric Manning, James Newsom and Richard Seigler
- Offense
- Single-back spread
- Defense
- 4–3
Drives and havoc
| Points per trip inside the 40 | Average start | Havoc | |
|---|---|---|---|
| Offense | 0.0 | own 24 | — allowed |
| Defense | 0.0 | own 39 | — caused |
A trip inside the 40 is a drive that reaches the opponent’s 40-yard line; points per trip is how many it scored on average (allowed, on defense). Average start is where drives began (the defense’s line is where its opponents started). Havoc is the share of plays ending in a tackle for loss, a forced fumble, an interception or a pass broken up. From CollegeFootballData.com.
Top recruits in the 2002 class
| Brandon Browner WR | ★★★ | No. 668 |
| Kellen Marshall APB | ★★★ | No. 670 |
| Arthur Giddens ATH | ★★ | No. 898 |
| Josh Linehan OG | ★★ | No. 898 |
| Joe Rudolph WDE | ★★ | No. 898 |
247Sports composite rankings via CollegeFootballData.com; national rank in the class.
The 2002 class by position
| Signed | Stars | Rating | |
|---|---|---|---|
| Running backs | 1 | 3.0 | 0.800 |
| Receivers | 1 | 3.0 | 0.822 |
| Offensive line | 2 | 2.0 | 0.767 |
| Defensive line | 3 | 2.0 | 0.767 |
| Defensive backs | 3 | 2.0 | 0.767 |
| Athletes and specialists | 1 | 2.0 | 0.767 |
| Whole class | 11 | 2.2 | 0.775 |
High-school signees by position group, with their average stars and 247Sports composite rating (out of 1), via CollegeFootballData.com. Athletes are signees with no set position.
Drafted in 2003
The 2003 draft| Rd 1 | Nick Barnett LB | Green Bay Packers |
| Rd 4 | Dennis Weathersby DB | Cincinnati Bengals |
| Rd 5 | James Lee DT | Green Bay Packers |
All-Pac-10
5 first team, 1 second teamFirst team
- Steven JacksonRBCoaches-1
 Eric ManningDLCoaches-1
- Richard SeiglerLBCoaches-1
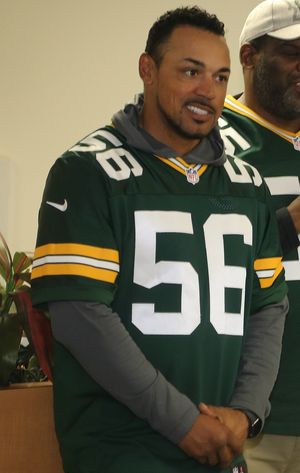 Nick BarnettLBCoaches-1
- Dennis WeathersbyDBCoaches-1
Second team
- Terrell RobertsDBCoaches-2
From Wikipedia’s 2002 all-conference team article, with the selectors that named each player (AP-1: the Associated Press’s first team).
2002 Pac-10 standings
| Team | Conf. | Overall | AP final |
|---|---|---|---|
| USC | 7–1 | 11–2 | 4 |
 Washington State | 7–1 | 10–3 | 10 |
| Arizona State | 5–3 | 8–6 | |
| Oregon State | 4–4 | 8–5 | |
| UCLA | 4–4 | 8–5 | |
| California | 4–4 | 7–5 | |
| Washington | 4–4 | 7–6 | |
| Oregon | 3–5 | 7–6 | |
| Arizona | 1–7 | 4–8 | |
| Stanford | 1–7 | 2–9 |
Ordered by conference winning percentage, then conference wins. Division splits and tiebreakers aren’t applied.