
2003 Miami
11–2 (6–1 Big East), coached by Larry Coker, finished No. 5 in the AP poll. Share
Schedule and results
- Best winBeat No. 5 Florida State 22–14Oct 11
Over the best-ranked team it beat, on the road.
- Biggest upsetBeat No. 9 Florida State 16–14Jan 1
Florida State was ranked No. 9, above it.
| Date | Opponent | Result | Elo |
|---|---|---|---|
| Aug 28 | vs Louisiana Tech | W 48–9 | 86% |
| Sep 6 | vs 21Florida | W 38–33 | 73% |
| Sep 13 | vs East Carolina | W 38–3 | 91% |
| Sep 20 | at Boston College | W 33–14 | 59% |
| Oct 2 | vs West Virginia | W 22–20 | 86% |
| Oct 11 | at 5Florida State | W 22–14 | 53% |
| Oct 18 | vs Temple | W 52–14 | 94% |
| Nov 1 | at 10Virginia Tech | L 7–31 | 63% |
| Nov 8 | vs 18Tennessee | L 6–10 | 73% |
| Nov 15 | vs Syracuse | W 17–10 | 78% |
| Nov 22 | vs Rutgers | W 34–10 | 93% |
| Nov 29 | at 20Pittsburgh | W 28–14 | 55% |
| Jan 1Bowls & playoff | vs9Florida StateOrange Bowl | W 16–14 | 57% |
Elo: a pregame chance from scores alone.
How it ended: Beat Florida State 16–14 in the Orange Bowl; No. 5 in the final AP poll; Big East champions.
In program history: The 12th-best season in program history by end-of-season Elo (of 96 on file).
AP poll, week by week
- Wk 1: 3
- Wk 3: 3
- Wk 4: 2
- Wk 5: 2
- Wk 6: 2
- Wk 7: 2
- Wk 8: 2
- Wk 9: 2
- Wk 10: 2
- Wk 11: 2
- Wk 12: 6
- Wk 13: 14
- Wk 14: 13
- Wk 15: 10
- Wk 16: 10
- Final: 5
Players on this team
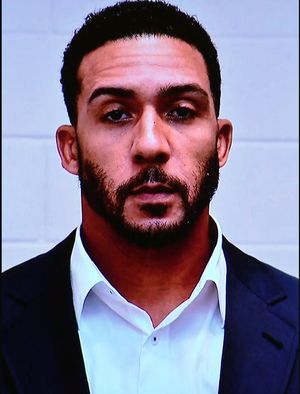 Kellen Winslow IITight end
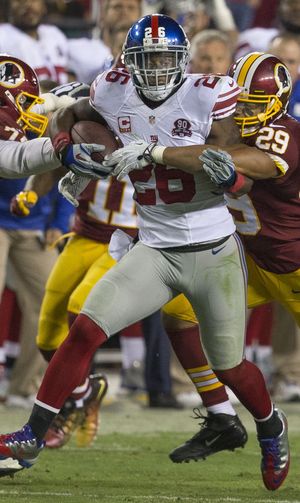 Antrel RolleDefensive back
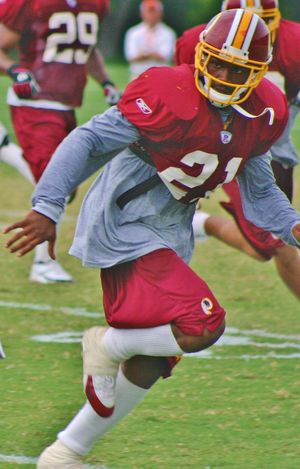 Sean TaylorSafety
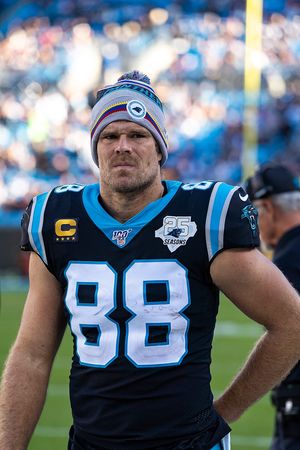 Greg OlsenTight end
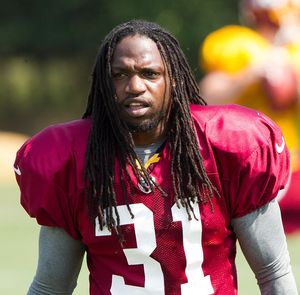 Brandon MeriweatherDefensive back
 Kelly JenningsDefensive back
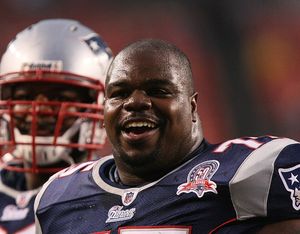 Vince WilforkDefensive tackle
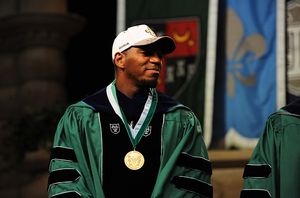 Jonathan VilmaLinebacker
- Devin HesterDefensive back
- Frank GoreRunning back
- Sinorice MossReceiver
- Tavares GoodenLinebacker
Before 2004 our records hold honors and the draft; these are the players whose college years here, from their Wikipedia articles or their honors, include 2003.
Big East champions6–1 in the conference, shared with West Virginia
John Mackey AwardKellen Winslow II, TE
2 consensus All-AmericansKellen Winslow Jr., TE; Sean Taylor, S
- Record
- 11–2
- Conference
- 6–1 shared first in Big East
- AP final
- No. 5 peak No. 2
- Points
- 361–196
- Coach
- Larry Coker
- Elo
- 1780 +52 this season
- SP+ rating
- 22.9 No. 8 of 117; offense No. 38, defense No. 3
- SRS
- 13.9 No. 12 of 117 in Division I-A
- Recruiting class
- No. 4
- Offensive coordinator
- Rob Chudzinski
- Defensive coordinator
- Randy Shannon
- Offense
- Pro-style
- Defense
- 4–3 Cover 2
Drives and havoc
| Points per trip inside the 40 | Average start | Havoc | |
|---|---|---|---|
| Offense | -0.2 | own 33 | — allowed |
| Defense | -0.1 | own 32 | — caused |
A trip inside the 40 is a drive that reaches the opponent’s 40-yard line; points per trip is how many it scored on average (allowed, on defense). Average start is where drives began (the defense’s line is where its opponents started). Havoc is the share of plays ending in a tackle for loss, a forced fumble, an interception or a pass broken up. From CollegeFootballData.com.
Top recruits in the 2003 class
| Kyle Wright PRO | ★★★★★ | No. 3 |
| Greg Olsen TE | ★★★★★ | No. 10 |
| Tyrone Moss RB | ★★★★★ | No. 30 |
| Tavares Gooden ILB | ★★★★ | No. 111 |
| Teraz McCray DT | ★★ | No. 1050 |
247Sports composite rankings via CollegeFootballData.com; national rank in the class.
The 2003 class by position
| Signed | Stars | Rating | |
|---|---|---|---|
| Quarterbacks | 1 | 5.0 | 0.998 |
| Running backs | 1 | 5.0 | 0.984 |
| Receivers | 1 | 5.0 | 0.994 |
| Defensive line | 1 | 2.0 | 0.767 |
| Linebackers | 1 | 4.0 | 0.934 |
| Whole class | 5 | 4.2 | 0.935 |
High-school signees by position group, with their average stars and 247Sports composite rating (out of 1), via CollegeFootballData.com. Athletes are signees with no set position.
Drafted in 2004
The 2004 draft| Rd 1 | Sean Taylor DB | Washington Redskins |
| Rd 1 | Kellen Winslow II TE | Cleveland Browns |
| Rd 1 | Jonathan Vilma LB | New York Jets |
| Rd 1 | D.J. Williams LB | Denver Broncos |
| Rd 1 | Vernon Carey OT | Miami Dolphins |
| Rd 1 | Vince Wilfork DT | New England Patriots |
| Rd 7 | Darrell McClover LB | New York Jets |
| Rd 7 | Alfonso Marshall DB | Chicago Bears |
| Rd 7 | Carlos Joseph OT | San Diego Chargers |
2003 Big East standings
| Team | Conf. | Overall | AP final |
|---|---|---|---|
 Miami | 6–1 | 11–2 | 5 |
| West Virginia | 6–1 | 8–5 | |
| Pittsburgh | 5–2 | 8–5 | |
| Virginia Tech | 4–3 | 8–5 | |
| Boston College | 3–4 | 8–5 | |
| Syracuse | 2–5 | 6–6 | |
| Rutgers | 2–5 | 5–7 | |
| Temple | 0–7 | 1–11 |
Ordered by conference winning percentage, then conference wins. Division splits and tiebreakers aren’t applied.