
2003 Houston
7–6 (4–4 Conference USA), coached by Art Briles. Share
Schedule and results
- Biggest winBeat Rice 48–14Aug 30
By 34 points, its widest win.
| Date | Opponent | Result | Elo |
|---|---|---|---|
| Aug 30 | vs Rice | W 48–14 | 54% |
| Sep 6 | at 5Michigan | L 3–50 | 20% |
| Sep 13 | at Louisiana | W 21–14 | 62% |
| Sep 20 | vs Mississippi State | W 42–35 | 66% |
| Sep 30 | at East Carolina | W 27–13 | 56% |
| Oct 11 | at Tulane | W 45–42 | 40% |
| Oct 18 | vs Memphis | L 14–45 | 73% |
| Oct 25 | vs 15TCU | L 55–62 | 30% |
| Nov 8 | vs Southern Miss | L 10–31 | 45% |
| Nov 15 | at Army | W 34–14 | 74% |
| Nov 22 | at Louisville | L 45–66 | 27% |
| Nov 29 | vs UAB | W 56–28 | 53% |
| Dec 25Bowls & playoff | vs Hawai’iHawai’i Bowl | L 48–54 | 38% |
Elo: a pregame chance from scores alone.
How it ended: Lost to Hawai’i 54–48 in the Hawai’i Bowl; unranked in the final AP poll; tied for 6th in the Conference USA.
In program history: The 62nd-best season in program history by end-of-season Elo (of 81 on file).
Players on this team
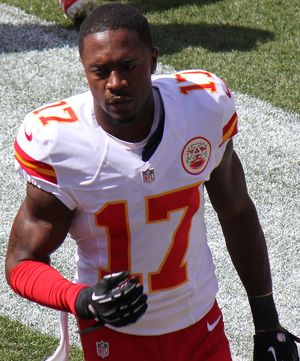
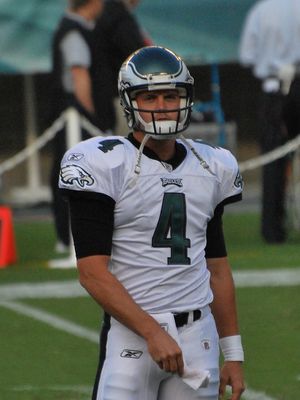
Before 2004 our records hold honors and the draft; these are the players whose college years here, from their Wikipedia articles or their honors, include 2003.
- Record
- 7–6
- Conference
- 4–4 tied for 6th in Conference USA
- AP final
- Unranked
- Points
- 448–468
- Coach
- Art Briles
- Elo
- 1434 +11 this season
- SP+ rating
- -8.5 No. 87 of 117; offense No. 21, defense No. 113
- SRS
- −6.2 No. 81 of 117 in Division I-A
- Recruiting class
- No. 59
- Defensive coordinator
- Ron Harris
- Offense
- Veer and shoot
- Defense
- 4–3
Drives and havoc
| Points per trip inside the 40 | Average start | Havoc | |
|---|---|---|---|
| Offense | 0.0 | own 30 | — allowed |
| Defense | 0.0 | own 32 | — caused |
A trip inside the 40 is a drive that reaches the opponent’s 40-yard line; points per trip is how many it scored on average (allowed, on defense). Average start is where drives began (the defense’s line is where its opponents started). Havoc is the share of plays ending in a tackle for loss, a forced fumble, an interception or a pass broken up. From CollegeFootballData.com.
Top recruits in the 2003 class
| Roderick Schwartz ATH | ★★★ | No. 682 |
| Jeffrey Filmore WR | ★★★ | No. 682 |
| Donnie Avery WR | ★★★ | No. 682 |
| Trent Allen ILB | ★★★ | No. 682 |
| Byron Alfred OG | ★★ | No. 1050 |
247Sports composite rankings via CollegeFootballData.com; national rank in the class.
The 2003 class by position
| Signed | Stars | Rating | |
|---|---|---|---|
| Receivers | 3 | 2.7 | 0.789 |
| Offensive line | 3 | 2.0 | 0.767 |
| Defensive line | 3 | 2.0 | 0.767 |
| Linebackers | 2 | 2.5 | 0.783 |
| Defensive backs | 2 | 2.0 | 0.767 |
| Athletes and specialists | 1 | 3.0 | 0.800 |
| Whole class | 14 | 2.3 | 0.776 |
High-school signees by position group, with their average stars and 247Sports composite rating (out of 1), via CollegeFootballData.com. Athletes are signees with no set position.
Drafted in 2004
The 2004 draft| Rd 6 | Rex Hadnot OG | Miami Dolphins |
2003 Conference USA standings
| Team | Conf. | Overall | AP final |
|---|---|---|---|
| Southern Miss | 8–0 | 9–4 | |
| TCU | 7–1 | 11–2 | 25 |
| Louisville | 5–3 | 9–4 | |
| Memphis | 5–3 | 9–4 | |
 South Florida | 5–3 | 7–4 | |
 Houston | 4–4 | 7–6 | |
| UAB | 4–4 | 5–7 | |
| Tulane | 3–5 | 5–7 | |
 Cincinnati | 2–6 | 5–7 | |
| East Carolina | 1–7 | 1–11 | |
| Army | 0–8 | 0–13 |
Ordered by conference winning percentage, then conference wins. Division splits and tiebreakers aren’t applied.