Neyland Stadium
- No. 6 in capacity
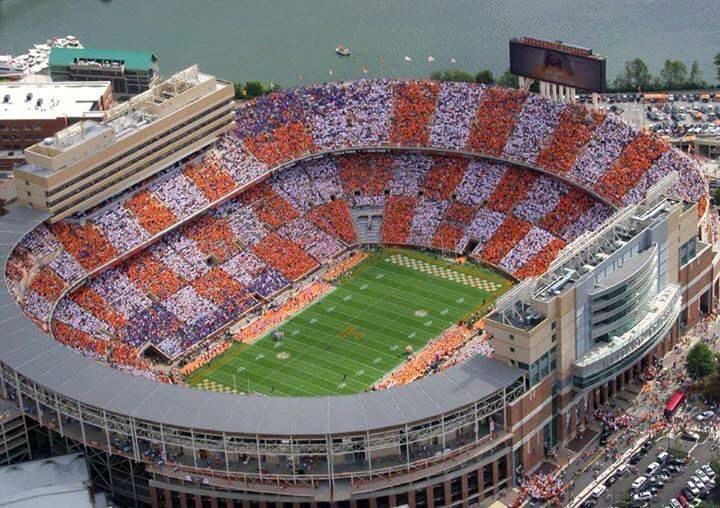
Neyland Stadium in Knoxville, TN, home of Tennessee. Capacity 101,915. Opened 1921. Share

- Capacity
- 101,915
- Opened
- 1921
- Surface
- Grass
- Roof
- Open air
- Elevation
- 892 ft
- Home team
- Tennessee
- Tennessee here
- 123–57 games on file since 2001
- College GameDay
- 13 times
Since it opened: Tennessee is 529–145–24 in home games from the 1921 season on. Our source names a game’s stadium only from 2001, so that count takes every earlier home game not marked neutral and may include a few played elsewhere.
Biggest games here
- Thriller2025: Georgia 44, Tennessee 41Among the biggest win-probability swings on file here
- Ranked meeting2022: Tennessee 52, Alabama 49No. 3 Alabama at No. 6 Tennessee
- Ranked meeting2016: Alabama 49, Tennessee 10No. 1 Alabama at No. 9 Tennessee
- Thriller2014: Florida 10, Tennessee 9Among the biggest win-probability swings on file here
- Upset2008: Wyoming 13, Tennessee 7Wyoming had a 23% chance by our ratings before kickoff
- Upset2005: Vanderbilt 28, Tennessee 24Vanderbilt had a 19% chance by our ratings before kickoff
- Ranked meeting2005: Georgia 27, Tennessee 14No. 5 Georgia at No. 8 Tennessee
From the games on file here, 2001 on: title and postseason games, meetings of two ranked teams, upsets by our pregame Elo ratings and the biggest swings in CollegeFootballData.com’s excitement index.
Capacity through the years
From 3,200 seats in 1921 to 101,915 today, across 23 documented figures. Sources disagree on eight stretches, drawn in orange; the table says which figure we use and why.
Every figure and its sources
| 1921–1925 | 3,200 | Official source |
| 1926–1928 | 6,800 | Official source |
| 1929 | 17,860 | Sources disagreeTennessee Athletics gives 6,800; Wikipedia gives 6,800. Tennessee’s current stadium page dates the 42-row West Stands to 1929 and Section X to 1937; the 2011 Volmanac (which Wikipedia follows) gives 1930 and 1934. Proposed for the current page, the department’s latest statement; a 1929-37 source would settle it. (Our reading, not yet reviewed.) |
| 1930–1933 | 17,860 | Official source |
| 1934–1936 | 17,860 | Sources disagreeTennessee Athletics gives 19,360. Tennessee’s current stadium page dates the 42-row West Stands to 1929 and Section X to 1937; the 2011 Volmanac (which Wikipedia follows) gives 1930 and 1934. Proposed for the current page, the department’s latest statement; a 1929-37 source would settle it. (Our reading, not yet reviewed.) |
| 1937 | 19,360 | Official source |
| 1938–1947 | 31,390 | Official source |
| 1948–1961 | 46,390 | Sources disagreeWikipedia gives 46,290. Both of Tennessee’s documents give 46,390 (31,390 plus 15,000 seats); Wikipedia’s 46,290 cites the 2011 Volmanac, which says 46,390. (Our reading, not yet reviewed.) |
| 1962–1965 | 52,227 | Sources disagreeTennessee Athletics gives 51,527. Tennessee’s current table (5,837 seats, 52,227) adds up row by row to its later totals; the 2011 Volmanac’s 5,137 and 51,527 differ, and Wikipedia’s 5,837 seats matches the current table. (Our reading, not yet reviewed.) |
| 1966–1967 | 58,122 | Sources disagreeTennessee Athletics gives 57,122. Tennessee’s current table (5,895 seats, 58,122) adds up to the 64,429 both of its documents give for 1968; the 2011 Volmanac’s 57,122 follows its 51,527 for 1962. (Our reading, not yet reviewed.) |
| 1968–1971 | 64,429 | Official source |
| 1972–1975 | 70,650 | Official source |
| 1976–1979 | 80,250 | Sources disagreeTennessee Athletics gives 79,250. Tennessee’s current table gives 80,250 (70,650 plus 9,600), as does Wikipedia; the 2011 Volmanac’s 79,250 is the same sum miscounted. (Our reading, not yet reviewed.) |
| 1980–1986 | 91,249 | Sources disagreeTennessee Athletics gives 89,749. Tennessee’s current table gives 91,249 (80,250 plus a net 10,999), consistent with its 1987 total of 91,110 after the suites’ net loss; the 2011 Volmanac’s 89,749 then rises to 91,110 for a net loss. (Our reading, not yet reviewed.) |
| 1987–1989 | 91,110 | Official source |
| 1990–1995 | 91,902 | Official source |
| 1996 | 102,544 | Official source |
| 1997–1999 | 102,854 | Official source |
| 2000–2005 | 104,079 | Sources disagreeWikipedia gives 104,037. Both of Tennessee’s documents give 104,079 after the 2000 East Executive Suites; Wikipedia’s 104,037 cites the 2011 Volmanac, which says 104,079. (Our reading, not yet reviewed.) |
| 2006–2007 | 102,037 | Official source |
| 2008–2009 | 100,011 | Official source |
| 2010–2021 | 102,455 | Official source |
| 2022 on | 101,915 | Official source |
How we know
- 1921–1925
- Neyland Stadium (facilities), Tennessee Athletics (How Neyland Stadium Grew (table)): 3,200 for 1921–1925, repeating University of Tennessee; read 2026-10-09
- 2011 Tennessee Football Media Guide: Honors & Records (Volmanac), Neyland Stadium, Tennessee Athletics (Neyland Stadium table, page 181): 3,200 for 1921–1925, repeating University of Tennessee; read 2026-10-09
- Neyland Stadium, Wikipedia (Structure and seating, 1921): 3,200 for 1921–1925, repeating University of Tennessee; read 2026-10-09
- 1926–1928
- Neyland Stadium (facilities), Tennessee Athletics (How Neyland Stadium Grew (table)): 6,800 for 1926–1928, repeating University of Tennessee; read 2026-10-09
- 2011 Tennessee Football Media Guide: Honors & Records (Volmanac), Neyland Stadium, Tennessee Athletics (Neyland Stadium table, page 181): 6,800 for 1926–1929, repeating University of Tennessee; read 2026-10-09
- Neyland Stadium, Wikipedia (Structure and seating, 1926): 6,800 for 1926–1929, repeating University of Tennessee; read 2026-10-09
- 1929
- 2011 Tennessee Football Media Guide: Honors & Records (Volmanac), Neyland Stadium, Tennessee Athletics (Neyland Stadium table, page 181): 6,800 for 1926–1929, repeating University of Tennessee; read 2026-10-09 (differs)
- Neyland Stadium, Wikipedia (Structure and seating, 1926): 6,800 for 1926–1929, repeating University of Tennessee; read 2026-10-09 (differs)
- Neyland Stadium (facilities), Tennessee Athletics (How Neyland Stadium Grew (table)): 17,860 for 1929–1936, repeating University of Tennessee; read 2026-10-09
- 1930–1933
- Neyland Stadium (facilities), Tennessee Athletics (How Neyland Stadium Grew (table)): 17,860 for 1929–1936, repeating University of Tennessee; read 2026-10-09
- 2011 Tennessee Football Media Guide: Honors & Records (Volmanac), Neyland Stadium, Tennessee Athletics (Neyland Stadium table, page 181): 17,860 for 1930–1933, repeating University of Tennessee; read 2026-10-09
- Neyland Stadium, Wikipedia (Structure and seating, 1930): 17,860 for 1930–1933, repeating University of Tennessee; read 2026-10-09
- 1934–1936
- Neyland Stadium (facilities), Tennessee Athletics (How Neyland Stadium Grew (table)): 17,860 for 1929–1936, repeating University of Tennessee; read 2026-10-09
- 2011 Tennessee Football Media Guide: Honors & Records (Volmanac), Neyland Stadium, Tennessee Athletics (Neyland Stadium table, page 181): 19,360 for 1934–1937, repeating University of Tennessee; read 2026-10-09 (differs)
- 1937
- 2011 Tennessee Football Media Guide: Honors & Records (Volmanac), Neyland Stadium, Tennessee Athletics (Neyland Stadium table, page 181): 19,360 for 1934–1937, repeating University of Tennessee; read 2026-10-09
- Neyland Stadium (facilities), Tennessee Athletics (How Neyland Stadium Grew (table)): 19,360 for 1937, repeating University of Tennessee; read 2026-10-09
- 1938–1947
- Neyland Stadium (facilities), Tennessee Athletics (How Neyland Stadium Grew (table)): 31,390 for 1938–1947, repeating University of Tennessee; read 2026-10-09
- 2011 Tennessee Football Media Guide: Honors & Records (Volmanac), Neyland Stadium, Tennessee Athletics (Neyland Stadium table, page 181): 31,390 for 1938–1947, repeating University of Tennessee; read 2026-10-09
- Neyland Stadium, Wikipedia (Structure and seating, 1937-38): 31,390 for 1938–1947, repeating University of Tennessee; read 2026-10-09
- 1948–1961
- Neyland Stadium (facilities), Tennessee Athletics (How Neyland Stadium Grew (table)): 46,390 for 1948–1961, repeating University of Tennessee; read 2026-10-09
- 2011 Tennessee Football Media Guide: Honors & Records (Volmanac), Neyland Stadium, Tennessee Athletics (Neyland Stadium table, page 181): 46,390 for 1948–1961, repeating University of Tennessee; read 2026-10-09
- Neyland Stadium, Wikipedia (Structure and seating, 1948): 46,290 for 1948–1961, no dates given; read 2026-10-09 (differs)
- 1962–1965
- Neyland Stadium (facilities), Tennessee Athletics (How Neyland Stadium Grew (table)): 52,227 for 1962–1965, repeating University of Tennessee; read 2026-10-09
- 2011 Tennessee Football Media Guide: Honors & Records (Volmanac), Neyland Stadium, Tennessee Athletics (Neyland Stadium table, page 181): 51,527 for 1962–1965, repeating University of Tennessee; read 2026-10-09 (differs)
- 1966–1967
- Neyland Stadium (facilities), Tennessee Athletics (How Neyland Stadium Grew (table)): 58,122 for 1966–1967, repeating University of Tennessee; read 2026-10-09
- 2011 Tennessee Football Media Guide: Honors & Records (Volmanac), Neyland Stadium, Tennessee Athletics (Neyland Stadium table, page 181): 57,122 for 1966–1967, repeating University of Tennessee; read 2026-10-09 (differs)
- 1968–1971
- 2011 Tennessee Football Media Guide: Honors & Records (Volmanac), Neyland Stadium, Tennessee Athletics (Neyland Stadium table, page 181): 64,429 for 1968–1971, repeating University of Tennessee; read 2026-10-09
- Neyland Stadium (facilities), Tennessee Athletics (How Neyland Stadium Grew (table)): 64,429 for 1968–1971, repeating University of Tennessee; read 2026-10-09
- Neyland Stadium, Wikipedia (Structure and seating, 1960s): 64,429 for 1968–1971, repeating University of Tennessee; read 2026-10-09
- 1972–1975
- 2011 Tennessee Football Media Guide: Honors & Records (Volmanac), Neyland Stadium, Tennessee Athletics (Neyland Stadium table, page 181): 70,650 for 1972–1975, repeating University of Tennessee; read 2026-10-09
- Neyland Stadium (facilities), Tennessee Athletics (How Neyland Stadium Grew (table)): 70,650 for 1972–1975, repeating University of Tennessee; read 2026-10-09
- 1976–1979
- Neyland Stadium (facilities), Tennessee Athletics (How Neyland Stadium Grew (table)): 80,250 for 1976–1979, repeating University of Tennessee; read 2026-10-09
- 2011 Tennessee Football Media Guide: Honors & Records (Volmanac), Neyland Stadium, Tennessee Athletics (Neyland Stadium table, page 181): 79,250 for 1976–1979, repeating University of Tennessee; read 2026-10-09 (differs)
- Neyland Stadium, Wikipedia (Structure and seating, 1972 and 1976): 80,250 for 1976–1979; read 2026-10-09
- 1980–1986
- Neyland Stadium (facilities), Tennessee Athletics (How Neyland Stadium Grew (table)): 91,249 for 1980–1986, repeating University of Tennessee; read 2026-10-09
- 2011 Tennessee Football Media Guide: Honors & Records (Volmanac), Neyland Stadium, Tennessee Athletics (Neyland Stadium table, page 181): 89,749 for 1980–1986, repeating University of Tennessee; read 2026-10-09 (differs)
- 1987–1989
- Neyland Stadium (facilities), Tennessee Athletics (How Neyland Stadium Grew (table)): 91,110 for 1987–1989, repeating University of Tennessee; read 2026-10-09
- 2011 Tennessee Football Media Guide: Honors & Records (Volmanac), Neyland Stadium, Tennessee Athletics (Neyland Stadium table, page 181): 91,110 for 1987–1989, repeating University of Tennessee; read 2026-10-09
- 1990–1995
- Neyland Stadium (facilities), Tennessee Athletics (How Neyland Stadium Grew (table)): 91,902 for 1990–1995, repeating University of Tennessee; read 2026-10-09
- 2011 Tennessee Football Media Guide: Honors & Records (Volmanac), Neyland Stadium, Tennessee Athletics (Neyland Stadium table, page 181): 91,902 for 1990–1995, repeating University of Tennessee; read 2026-10-09
- Neyland Stadium, Wikipedia (Structure and seating, 1980-90): 91,902 for 1990–1995, repeating University of Tennessee; read 2026-10-09
- 1996
- Neyland Stadium (facilities), Tennessee Athletics (How Neyland Stadium Grew (table)): 102,544 for 1996, repeating University of Tennessee; read 2026-10-09
- 2011 Tennessee Football Media Guide: Honors & Records (Volmanac), Neyland Stadium, Tennessee Athletics (Neyland Stadium table, page 181): 102,544 for 1996, repeating University of Tennessee; read 2026-10-09
- 1997–1999
- Neyland Stadium (facilities), Tennessee Athletics (How Neyland Stadium Grew (table)): 102,854 for 1997–1999, repeating University of Tennessee; read 2026-10-09
- 2011 Tennessee Football Media Guide: Honors & Records (Volmanac), Neyland Stadium, Tennessee Athletics (Neyland Stadium table, page 181): 102,854 for 1997–1999, repeating University of Tennessee; read 2026-10-09
- 2000–2005
- Neyland Stadium (facilities), Tennessee Athletics (How Neyland Stadium Grew (table)): 104,079 for 2000–2005, repeating University of Tennessee; read 2026-10-09
- 2011 Tennessee Football Media Guide: Honors & Records (Volmanac), Neyland Stadium, Tennessee Athletics (Neyland Stadium table, page 181): 104,079 for 2000–2005, repeating University of Tennessee; read 2026-10-09
- Neyland Stadium, Wikipedia (Structure and seating, 1996-2000): 104,037 for 2000–2005; read 2026-10-09 (differs)
- 2006–2007
- Neyland Stadium (facilities), Tennessee Athletics (How Neyland Stadium Grew (table)): 102,037 for 2006–2007, repeating University of Tennessee; read 2026-10-09
- 2008–2009
- Neyland Stadium (facilities), Tennessee Athletics (How Neyland Stadium Grew (table)): 100,011 for 2008–2009, repeating University of Tennessee; read 2026-10-09
- Neyland Stadium, Wikipedia (Structure and seating, 2006-2010): 100,011 for 2009; read 2026-10-09
- 2010–2021
- Neyland Stadium (facilities), Tennessee Athletics (How Neyland Stadium Grew (table)): 102,455 for 2010–2021, repeating University of Tennessee; read 2026-10-09
- 2011 Tennessee Football Media Guide: Honors & Records (Volmanac), Neyland Stadium, Tennessee Athletics (Master Plan Renovations, page 181): 102,455 for 2010–2021, repeating University of Tennessee; read 2026-10-09
- Neyland Stadium, Wikipedia (Structure and seating, 2010): 102,455 for 2010–2021, repeating University of Tennessee; read 2026-10-09
- 2022 on
- Neyland Stadium (facilities), Tennessee Athletics (More Than a Century of Tradition): 101,915 for 2022 on, repeating University of Tennessee; read 2026-10-09
- Neyland Stadium (facilities), Tennessee Athletics (How Neyland Stadium Grew (table)): 101,915 for 2022 on, repeating University of Tennessee; read 2026-10-09
- Neyland Stadium, Wikipedia (infobox, capacity, cited to Tennessee’s facilities page): 101,915 for 2022 on, repeating University of Tennessee; read 2026-10-09
A list that ends one range in the year the next begins (“1969–1972”, then “1972–1976”) is read as a change that year.
Official source: the school’s own publication. Independently corroborated: two or more sources that don’t copy each other. Sources disagree: we show both and say which we use and why. Single source: one source only. Documented for 106 of the 106 seasons since 1921; 41 disputed (as of 2026-10-18). All the evidence.
Crowds season by season
Biggest crowds on file
| 109,061 | Florida at Tennessee | 2004 |
| 108,722 | Florida at Tennessee | 2002 |
| 108,625 | UNLV at Tennessee | 2004 |
| 108,472 | LSU at Tennessee | 2001 |
| 108,470 | Georgia at Tennessee | 2005 |
Bars are each season’s average crowd, dots its biggest (the record in orange), the dashed rule today’s capacity. Attendance is on file for most games from 2001 on.
College GameDay here
ESPN’s College GameDay has broadcast from Neyland Stadium 13 times, first in 1995.
| Sep 26, 2026 | Texas 20, Tennessee 17 | Outside Ayres Hall | |
| Sep 13, 2025 | Georgia 44, Tennessee 41 | Ayres Hall | |
| Oct 15, 2022 | Tennessee 52, Alabama 49 | Ayres Hall | |
| Sep 24, 2022 | Tennessee 38, Florida 33 | Ayres Hall | |
| Sep 24, 2016 | Tennessee 38, Florida 28 | Ayres Hall | |
| Sep 15, 2012 | Florida 37, Tennessee 20 | Circle Park | |
| Oct 2, 2004 | Auburn 34, Tennessee 10 | Outside Thompson–Boling Arena | |
| Nov 9, 2002 | Miami 26, Tennessee 3 | Outside Thompson–Boling Arena | |
| Sep 21, 2002 | Florida 30, Tennessee 13 | Outside Thompson–Boling Arena | |
| Sep 16, 2000 | Florida 27, Tennessee 23 | Outside Thompson–Boling Arena | |
| Nov 6, 1999 | Tennessee 38, Notre Dame 14 | ||
| Sep 21, 1996 | Florida 35, Tennessee 29 | ||
| Sep 9, 1995 | Tennessee 30, Georgia 27 |
College GameDay’s sites from Wikipedia’s list of College GameDay locations (CC BY-SA).
Weather on game day
Coldest kickoffs
- 38°F Kentucky at Tennessee, 2012, a few clouds
- 39°F Texas A&M at Tennessee, 2020, clear
- 41°F South Alabama at Tennessee, 2021, clear
Hottest kickoffs
Coldest game days before 2004
- High 15°F Kentucky at Tennessee, 1950
- High 31°F Kentucky at Tennessee, 1930
- High 32°F LSU at Tennessee, 1934
Hottest game days before 2004
- High 95°F Mississippi State at Tennessee, 1955
- High 94°F New Mexico at Tennessee, 1983
- High 93°F Middle Tennessee at Tennessee, 2002
Snow on game day
Kickoffs: the NOAA report nearest kickoff from the closest weather station (NOAA NCEI Integrated Surface Database). Game days: the day’s high and snowfall at the NOAA station nearest the stadium, for Tennessee’s home games before 2004 (NOAA GHCN-Daily, public domain).
The stadium’s history
- Former names
- Shields–Watkins Field (1921–present)
- Architect
- McCarty Holsaple McCarty (renovations)
- Surface over the years
- Grass (1921–1967, 1994–present)
Artificial turf (1968–1993) - Expanded
- 1926, 1929, 1937–1938, 1948, 1962, 1966, 1968, 1972, 1976, 1980, 1987, 1990, 1996
- Renovated
- 2006, 2008, 2010, 2022
- Record crowd
- 109,061, on September 18, 2004, vs. Florida
From the stadium’s Wikipedia article, Neyland Stadium.
From above
Statues

Statues: Wikidata (CC0) and Wikimedia Commons: statues placed at the stadium or within a few hundred meters of it. Names link to their pages here; each statue links to its record there.
Recent games here
| Oct 17, 2026 | 14Tennessee 26, 6Alabama 10 |
| Oct 3, 2026 | 17Tennessee 24, Auburn 14 |
| Sep 26, 2026 | 1Texas 20, 14Tennessee 17 |
| Sep 19, 2026 | 15Tennessee 42, Kennesaw State 9 |
| Sep 5, 2026 | 20Tennessee 56, Furman 9 |
| Nov 29, 2025 | 12Vanderbilt 45, 18Tennessee 24 |
| Nov 15, 2025 | 21Tennessee 42, New Mexico State 9 |
| Nov 1, 2025 | 18Oklahoma 33, 14Tennessee 27 |
| Oct 11, 2025 | 12Tennessee 34, Arkansas 31 |
| Sep 20, 2025 | 15Tennessee 56, UAB 24 |
| Sep 13, 2025 | 6Georgia 44, 15Tennessee 41 |
| Sep 6, 2025 | 22Tennessee 72, East Tennessee State 17 |
Pouring rights
Coca-Cola has the stadium’s soft-drink pouring rights, on record since 2024. Single source.
- Stadium Journey; read 2026-10-10