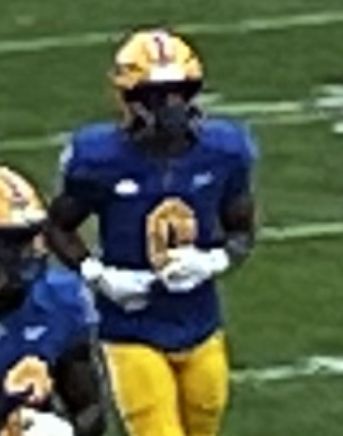

 Running back, Pittsburgh (from Western Carolina), 2022–25
Desmond Reid
Lettered 2024–25 (school media guide)
- Number
- No. 0
- Height
- 5′8″
- Weight
- 175 lb
- Class (2025)
- Senior
- Hometown
- Miami Gardens, FL

Wikipedia readers: about 1,236 a month over the past year
Desmond Reid played running back at Western Carolina (2022–23) and Pittsburgh (2024–25).
At a glance
Career highs
211rushing yards, career highat Chattanooga, 20235rushing touchdowns, career highat The Citadel, 202311catches, career highat North Carolina, 2024155receiving yards, career hightwice; last at Florida State, 20252receiving touchdowns, career hightwice; last at Florida State, 2025Rushing
| Season | Team | Car | Yds | Avg | TD | Long |
|---|---|---|---|---|---|---|
| 2022 | Western Carolina | 117 | 824 | 7.0 | 4 | 58 |
| 2023 | Western Carolina | 126 | 888 | 7.0 | 13 | 70 |
| 2024 | Pittsburgh | 184 | 966 | 5.3 | 5 | 72 |
| 2025 | Pittsburgh | 60 | 278 | 4.6 | 2 | 53 |
| Career | 487 | 2,956 | 6.1 | 24 | 72 | |
Receiving
| Season | Team | Rec | Yds | Avg | TD | Long |
|---|---|---|---|---|---|---|
| 2022 | Western Carolina | 21 | 212 | 10.1 | 1 | 43 |
| 2023 | Western Carolina | 18 | 190 | 10.6 | 0 | 39 |
| 2024 | Pittsburgh | 52 | 579 | 11.1 | 4 | 72 |
| 2025 | Pittsburgh | 23 | 317 | 13.8 | 2 | 50 |
| Career | 114 | 1,298 | 11.4 | 7 | 72 | |
Returns
| Season | Team | PR | Yds | TD |
|---|---|---|---|---|
| 2024 | Pittsburgh | 13 | 159 | 1 |
| 2025 | Pittsburgh | 5 | 105 | 1 |
| Career | 18 | 264 | 2 | |
Season lines from CollegeFootballData, regular season and bowls.
On the roster
| Season | Team | No. | Pos | Class | Ht | Wt |
|---|---|---|---|---|---|---|
| 2022 | Western Carolina | 0 | RB | Fr. | ||
| 2023 | Western Carolina | 0 | RB | So. | ||
| 2024 | Pittsburgh | 0 | RB | Jr. | ||
| 2025 | Pittsburgh | 0 | RB | Sr. | 5′8″ | 175 |
As each season’s roster listed the player (CollegeFootballData). Classes before the latest listing are counted back from it; “Yr 1” is the year on file where that count can’t place a season he played (a redshirt, transfer or 2020 year); height and weight as last listed.
Per play
| Season | Team | Plays | EPA/play | Pctile | Median | Total | Usage | Adj. rush |
|---|---|---|---|---|---|---|---|---|
| 2022 | Western Carolina (FCS) | 117 | 0.27 | 84th (n=470) | 0.14 | 31.7 | 20% | – |
| 2023 | Western Carolina (FCS) | 145 | 0.49 | 98th (n=450) | 0.17 | 70.8 | 28% | – |
| 2024 | Pittsburgh | 233 | 0.29 | 84th (n=434) | 0.16 | 66.8 | 30% | 0.17 |
| 2025 | Pittsburgh | 86 | 0.24 | 87th (n=576) | 0.10 | 20.9 | 18% | 0.07 |
Expected points added: how much the player’s plays moved the team’s expected score, per play and in total. Plays: total EPA divided by EPA per play, the plays the source credits to him (for a receiver roughly his catches and runs, not every target; for a passer, not every attempt), so it can differ from attempts plus carries. Percentile: against the position’s regulars that season across all divisions on file (quarterbacks with 150+ plays, backs 60+, receivers and tight ends 30+), with how many there were (n) and their median; a dash means too few plays to rank. A season in progress uses the full-season bar scaled by games played, never below 75 plays for quarterbacks, 30 for backs and 20 for receivers. The cohort grows or shrinks with the source’s coverage each season (2025 lists far more players), so compare percentiles rather than raw EPA across years. FCS seasons are marked. Usage: the share of the team’s plays the player was part of (shown from 20 plays). Adjusted pass and rush: EPA per play adjusted for the defenses faced (CollegeFootballData’s WEPA). From CollegeFootballData, 2013 on.
Rushing detail
| Season | Team | Success | Line yards | Second level | Open field | Stuffed |
|---|---|---|---|---|---|---|
| 2025 | Pittsburgh | 35% | 2.50 | 0.80 | 1.20 | 26% |
Where his yards came from, per carry: line yards are the ones credited to the blockers (the first few, and losses), second level the yards 5 to 10 past the line, open field those beyond 10. Success: carries that kept the offense on schedule. Stuffed: carries stopped at or behind the line. From CollegeFootballData, FBS games, 2025 on.
Game by game
2025 Pittsburgh 7 games, 278 rushing yards, 2 TD
| Date | Opponent | Result | Car | Rush yds | Rush TD | Rec | Rec yds | Rec TD |
|---|---|---|---|---|---|---|---|---|
| Aug 30 | vs. Duquesne | W 61–9 | 8 | 66 | 1 | 1 | 2 | 0 |
| Sep 6 | vs. Central Michigan | W 45–17 | 10 | 46 | 0 | 5 | 69 | 0 |
| Sep 13 | at West Virginia | L 24–31 | 6 | 30 | 0 | – | – | – |
| Oct 11 | at Florida State | W 34–31 | 12 | 45 | 0 | 8 | 155 | 2 |
| Oct 18 | at Syracuse | W 30–13 | 6 | 38 | 0 | – | – | – |
| Oct 25 | vs. NC State | W 53–34 | 13 | 41 | 1 | 3 | 28 | 0 |
| Nov 15 | vs. Notre Dame | L 15–37 | 5 | 12 | 0 | 6 | 63 | 0 |
2024 Pittsburgh 11 games, 966 rushing yards, 5 TD
| Date | Opponent | Result | Car | Rush yds | Rush TD | Rec | Rec yds | Rec TD |
|---|---|---|---|---|---|---|---|---|
| Aug 31 | vs. Kent State | W 55–24 | 14 | 145 | 1 | 3 | 11 | 0 |
| Sep 7 | at Cincinnati | W 28–27 | 19 | 148 | 0 | 6 | 106 | 1 |
| Sep 14 | vs.West Virginia | W 38–34 | 11 | 26 | 0 | 4 | 50 | 2 |
| Oct 5 | at North Carolina | W 34–24 | 18 | 55 | 0 | 11 | 155 | 1 |
| Oct 12 | vs. California | W 17–15 | 16 | 120 | 2 | 1 | 19 | 0 |
| Oct 24 | vs.Syracuse | W 41–13 | 11 | 47 | 0 | – | – | – |
| Nov 2 | at SMU | L 25–48 | 13 | 49 | 1 | 6 | 44 | 0 |
| Nov 9 | vs. Virginia | L 19–24 | 16 | 80 | 0 | 2 | 43 | 0 |
| Nov 16 | vs. Clemson | L 20–24 | 14 | 68 | 0 | 10 | 108 | 0 |
| Nov 23 | at Louisville | L 9–37 | 19 | 59 | 0 | 4 | 28 | 0 |
| Dec 26 ✦ | vs. Toledo | L 46–48 | 33 | 169 | 1 | 5 | 15 | 0 |
2023 Western Carolina 8 games, 888 rushing yards, 13 TD
| Date | Opponent | Result | Car | Rush yds | Rush TD | Rec | Rec yds | Rec TD |
|---|---|---|---|---|---|---|---|---|
| Sep 2 | vs. Arkansas | L 13–56 | 11 | 11 | 1 | 3 | 35 | 0 |
| Sep 9 | vs. Samford | W 30–7 | 27 | 170 | 1 | 2 | 13 | 0 |
| Sep 16 | at Eastern Kentucky | W 27–24 | 25 | 169 | 1 | 3 | 28 | 0 |
| Sep 23 | vs. Charleston Southern | W 77–21 | 13 | 111 | 2 | 1 | 4 | 0 |
| Sep 30 | at The Citadel | W 49–14 | 18 | 167 | 5 | 3 | 28 | 0 |
| Oct 7 | at Chattanooga | W 52–50 | 15 | 211 | 2 | – | – | – |
| Oct 21 | vs. Furman | L 17–29 | 2 | 10 | 0 | 1 | 39 | 0 |
| Nov 18 | at VMI | L 24–27 | 15 | 39 | 1 | 5 | 43 | 0 |
2022 Western Carolina 10 games, 824 rushing yards, 4 TD
| Date | Opponent | Result | Car | Rush yds | Rush TD | Rec | Rec yds | Rec TD |
|---|---|---|---|---|---|---|---|---|
| Sep 3 | atCharleston Southern | W 52–38 | 9 | 69 | 1 | 1 | 8 | 0 |
| Sep 10 | at Georgia Tech | L 17–35 | 10 | 47 | 0 | 4 | 65 | 0 |
| Sep 17 | vs. Presbyterian | W 77–21 | 12 | 175 | 2 | 2 | 4 | 0 |
| Sep 24 | atSamford | L 12–35 | 15 | 58 | 0 | 2 | 8 | 0 |
| Oct 1 | vs.VMI | W 38–17 | 15 | 96 | 0 | 1 | 1 | 0 |
| Oct 8 | at Mercer | L 6–49 | 2 | 8 | 0 | – | – | – |
| Oct 22 | vs.The Citadel | L 21–34 | 13 | 129 | 0 | 1 | 6 | 0 |
| Nov 5 | vs. Wofford | W 36–29 | 20 | 112 | 0 | 3 | 45 | 0 |
| Nov 12 | at East Tennessee State | W 20–17 | 14 | 72 | 0 | 3 | 62 | 0 |
| Nov 19 | vs.Chattanooga | W 32–29 | 7 | 58 | 1 | 4 | 13 | 1 |
Box scores from CollegeFootballData, 2004 on. ✦ postseason; ★ a career high on file.
Before the draft
| Drill | Combine 2026 | Combine or pro day 2026 |
|---|---|---|
| Height | 5′6¼″ | |
| Weight | 174 lb | |
| Arm length | 28⅛″ | |
| Hand size | 8¼″ | |
| Wingspan | 69¾″ | |
| 40-yard dash | 4.58 s | |
| 10-yard split | 1.58 sW | |
| Vertical jump | 35″ | |
| Broad jump | 10′0″W | |
| 3-cone drill | 7.20 sW | |
| 20-yard shuttle | 4.27 sW |
Combine or pro day: the source doesn’t say which. Unmarked: Combine and pro day results compiled by array-carpenter (nfl-draft-data); W: Pre-draft measurables: Wikipedia (CC BY-SA).
Is this you, or do you know of something wrong or missing here? Suggest a correction. We check each one against a source before changing the page.